
 1 hour ago
6
1 hour ago
6
Tokenized real-world assets, often called RWAs, are digital tokens on a blockchain that represent ownership of an off-chain asset. The asset can be a government bond, a loan, a fund share, a stock or a bar of gold. Supporters point to faster settlement, smaller minimum purchases and assets that can serve as collateral.
The market has grown quickly in 2026, but the totals depend on who is counting. Trackers report anywhere from about $19 billion to more than $60 billion, because they define tokenized assets in different ways. This article pulls together data from several recent reports to show where the market stands.
Most of the value sits in a few places. US Treasuries lead, private credit follows, and real estate remains very small. The sections below cover market size, growth, major products, asset classes, holders, lending, stocks and forecasts.
How Big Is the Tokenized RWA Market in 2026?
There is no single agreed figure. As of mid-September 2026, tracked data cited by Learnsignal shows about $38.8 billion in tokens distributed on-chain. Those tokens represent underlying assets worth around $365 billion, or about $305 billion once stablecoins are removed.
Other trackers land in a similar range for distributed assets. Chainalysis put the market at $36.07 billion at the end of the second quarter of 2026. Dune reported that total supply passed $34 billion this year, and Centrifuge reported a rise from about $25 billion to $37 billion in the first seven months.
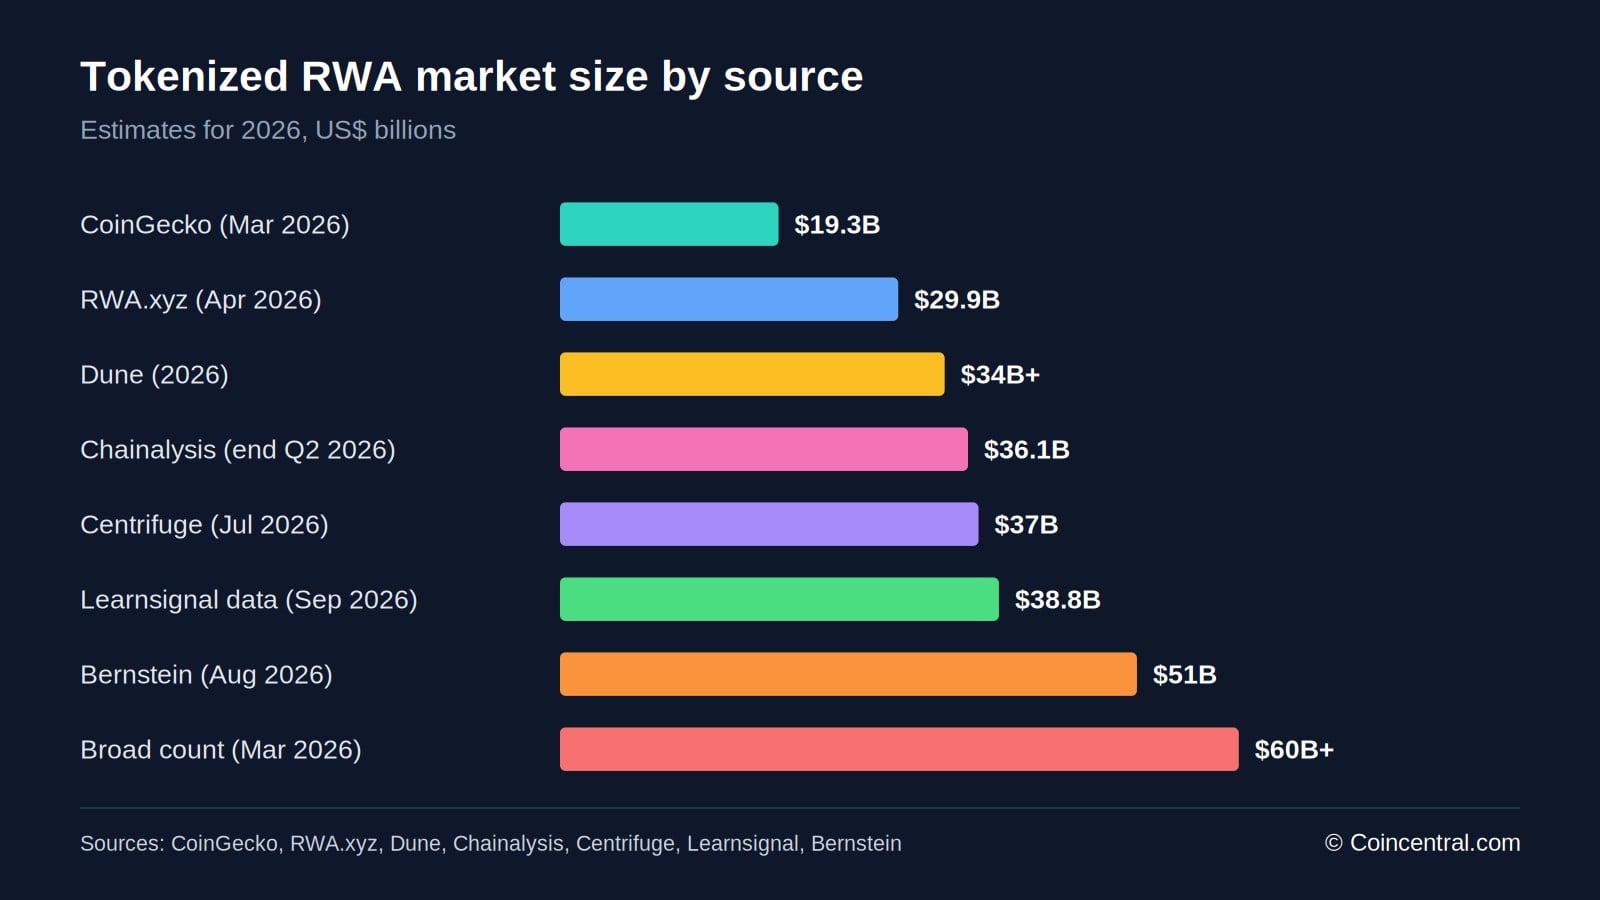 Figure 1: Estimates of the tokenized RWA market in 2026 range from about $19 billion to more than $60 billion.
Some counts are lower and some are much higher. CoinGecko measured a market capitalization of $19.32 billion in March 2026. Bernstein, cited by CoinDesk, said about $51 billion of tokenized assets are on-chain, and broader definitions have produced totals above $60 billion.
| CoinGecko | Market capitalization | Mar 2026 | $19.32B |
| RWA.xyz via EtherWorld | Tokenized RWA value | Apr 16, 2026 | $29.9B |
| Dune | Total supply | 2026 | Over $34B |
| Chainalysis | Tokenized RWA value | End of Q2 2026 | $36.07B |
| Centrifuge | Tokenized asset value | Jul 2026 | About $37B |
| Learnsignal tracked data | Tokens distributed | Mid-Sep 2026 | $38.8B |
| Bernstein via CoinDesk | On-chain tokenized RWAs | Aug 2026 | About $51B |
| Broad definition | Total value | Mar 2026 | Over $60B |
The gap comes from method. Market capitalization counts the circulating value of tokens. Total value locked can include assets held in smart contracts, such as collateral that does not trade freely.
Some trackers also count assets on permissioned chains, while others count only publicly distributed tokens. Chainalysis noted that activity on private networks such as Canton does not appear in on-chain holder counts. The full market may be larger than any single dataset shows.
For scale, CoinDesk Data reported that the total stablecoin market capitalization reached $317 billion in March 2026. A distributed RWA market of roughly $30 billion to $40 billion is a small fraction of that figure.
Dates matter too. Several of these figures were taken in different months, and the market moved between them. A March 2026 report will look small next to a September 2026 report, even if both use the same method.
How Fast Is Tokenized Asset Growth?
Growth over the past year is large on every measure. RWA.xyz data shows the market rose from $8.8 billion on April 16, 2025, to about $29.9 billion on April 16, 2026. That is an increase of about 240%.
CoinGecko reported a rise of 256.7%, from $5.42 billion in January 2025 to $19.32 billion in March 2026. Yellow.com research cited year-over-year growth of 184% in its mid-2026 count. Chainalysis reported 135% growth over the prior period for a market that ended the second quarter at $36.07 billion.
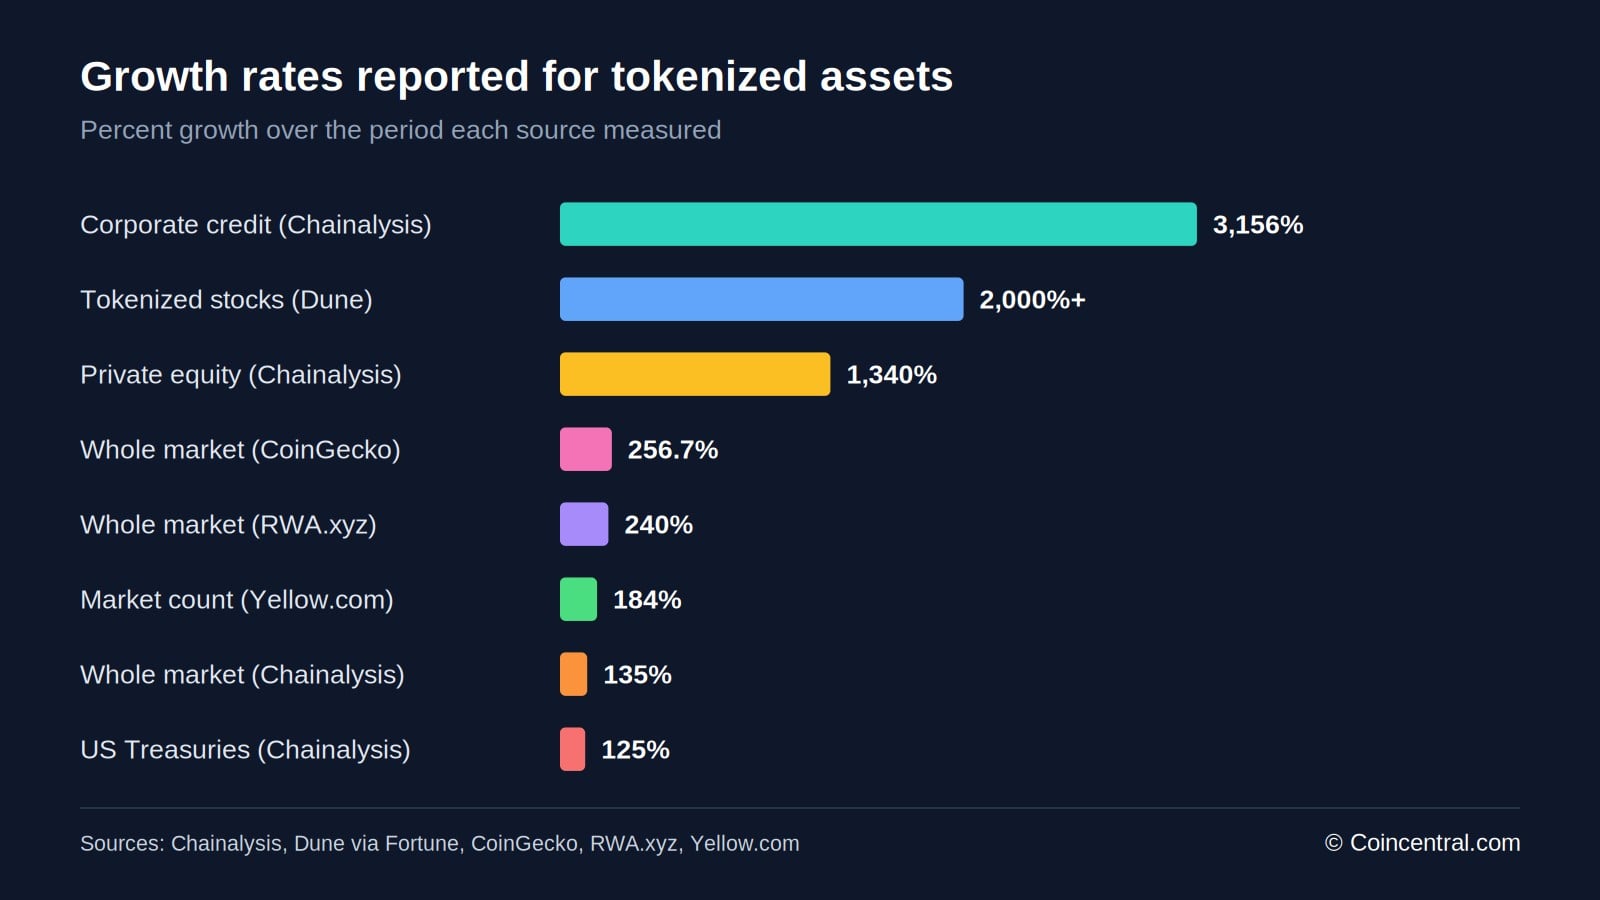 Figure 2: Growth rates differ by source, and the largest percentages come from the smallest starting bases.
The fastest percentage gains came from small starting points. Chainalysis found that corporate credit grew 3,156% and private equity 1,340%, but those moves took each category from tens of millions of dollars to about a couple of billion. Dune reported that tokenized stocks rose more than 2,000%.
Treasuries grew less in percentage terms but added more dollars. Chainalysis reported a 125% rise, from $6.86 billion to $15.42 billion. That is more than the next three categories combined in dollar terms.
Base effects matter when reading these numbers. A category that moves from $50 million to $1.5 billion shows a huge percentage gain, yet it adds little to the total. Readers should check the dollar change as well as the percentage.
| Tokenized RWA market | About 240% | Apr 2025 to Apr 2026, RWA.xyz |
| Tokenized RWA market cap | 256.7% | Jan 2025 to Mar 2026, CoinGecko |
| Tokenized RWA market | 135% | Period to Q2 2026, Chainalysis |
| US Treasuries | 125% | $6.86B to $15.42B, Chainalysis |
| Tokenized stocks | Over 2,000% | Past year, Dune |
| Tokenized stocks | Over 17% | 30 days to Sep 2026, Learnsignal |
Short-term data shows the mix is still changing. Learnsignal’s 30-day figures for September 2026 showed tokenized stocks growing more than 17%, the fastest category. Tokenized Treasuries slipped slightly over the same stretch.
Tokenized US Treasuries: The Largest Category
US government debt is the largest tokenized asset class. Chainalysis counted $15.42 billion on-chain in the period ending mid-2026, or 42.8% of all tokenized RWA value. Learnsignal’s September data shows about $15.7 billion, roughly 40% of the market.
Other counts are lower. MetaMask, citing RWA.xyz, listed about $12.88 billion in early April 2026, up from roughly $5 billion in late 2024. Astraea Law found that tokenized Treasury funds crossed about $15 billion by mid-May 2026.
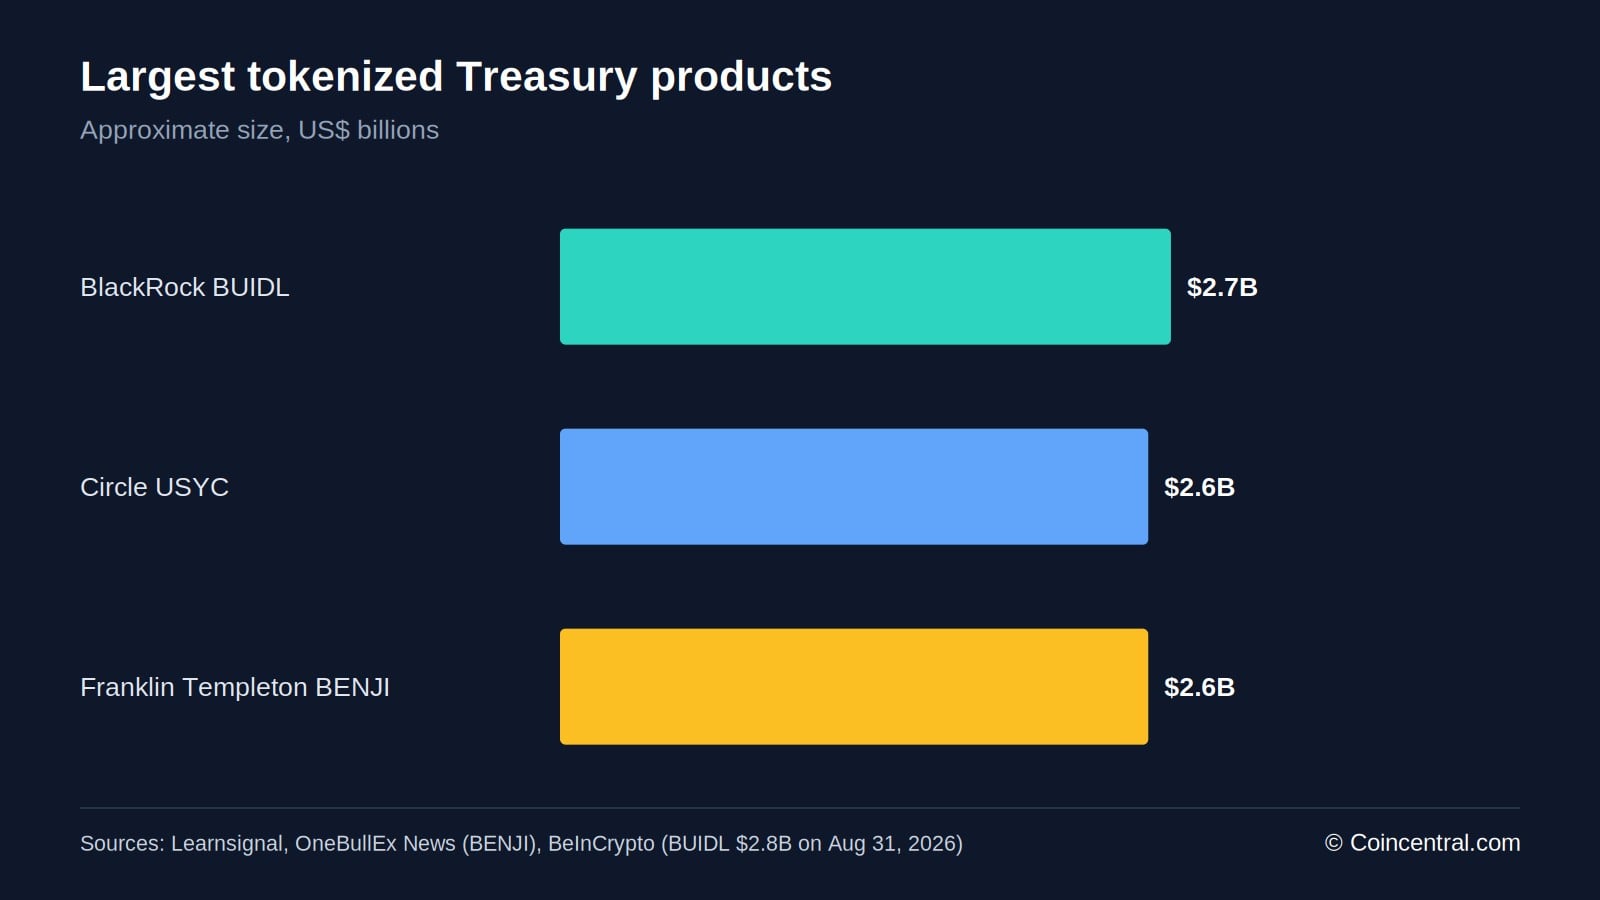 Figure 3: Three funds each hold about $2.6 billion to $2.7 billion in tokenized Treasuries.
Three products stand out. BlackRock’s BUIDL fund holds roughly $2.7 billion, and BeInCrypto put its market cap at $2.8 billion on August 31, 2026. Circle’s USYC holds around $2.6 billion, and Franklin Templeton’s BENJI fund is also reported at $2.6 billion.
| BUIDL | BlackRock with Securitize | $2.7B to $2.8B | Live on nine blockchain networks |
| USYC | Circle | About $2.6B | Works like a tokenized money market fund |
| BENJI | Franklin Templeton | About $2.6B | Running since 2021; $1.5B on BNB Chain |
These products hold short-term government securities and issue tokens that represent a claim on the pool. MetaMask lists typical yields of about 3% to 5%, with daily redemption common. Some tokens grow in price as interest builds, while others keep a price near $1 and add more tokens to the wallet.
Learnsignal makes a useful point about what changes. The legal exposure is familiar, since a tokenized Treasury fund still holds Treasury bills. What changes is the record-keeping layer, where transfers can settle in minutes instead of days and the token can serve as collateral without a separate custody handoff.
The risks sit mostly in the token layer. The underlying debt carries little credit risk, but holders face counterparty, smart contract and redemption delay risk. Franklin Templeton has also received SEC no-action relief that lets its mutual funds and ETFs invest in BENJI, with implementation possible as early as the fourth quarter of 2026.
Tokenized Assets by Category
Each category behaves differently. MetaMask, using RWA.xyz data from early April 2026, lists Treasuries at about $12.88 billion and commodities at about $7.37 billion. Private credit stood near $5 billion in distributed value, though broader counts reach $18 billion to $19 billion.
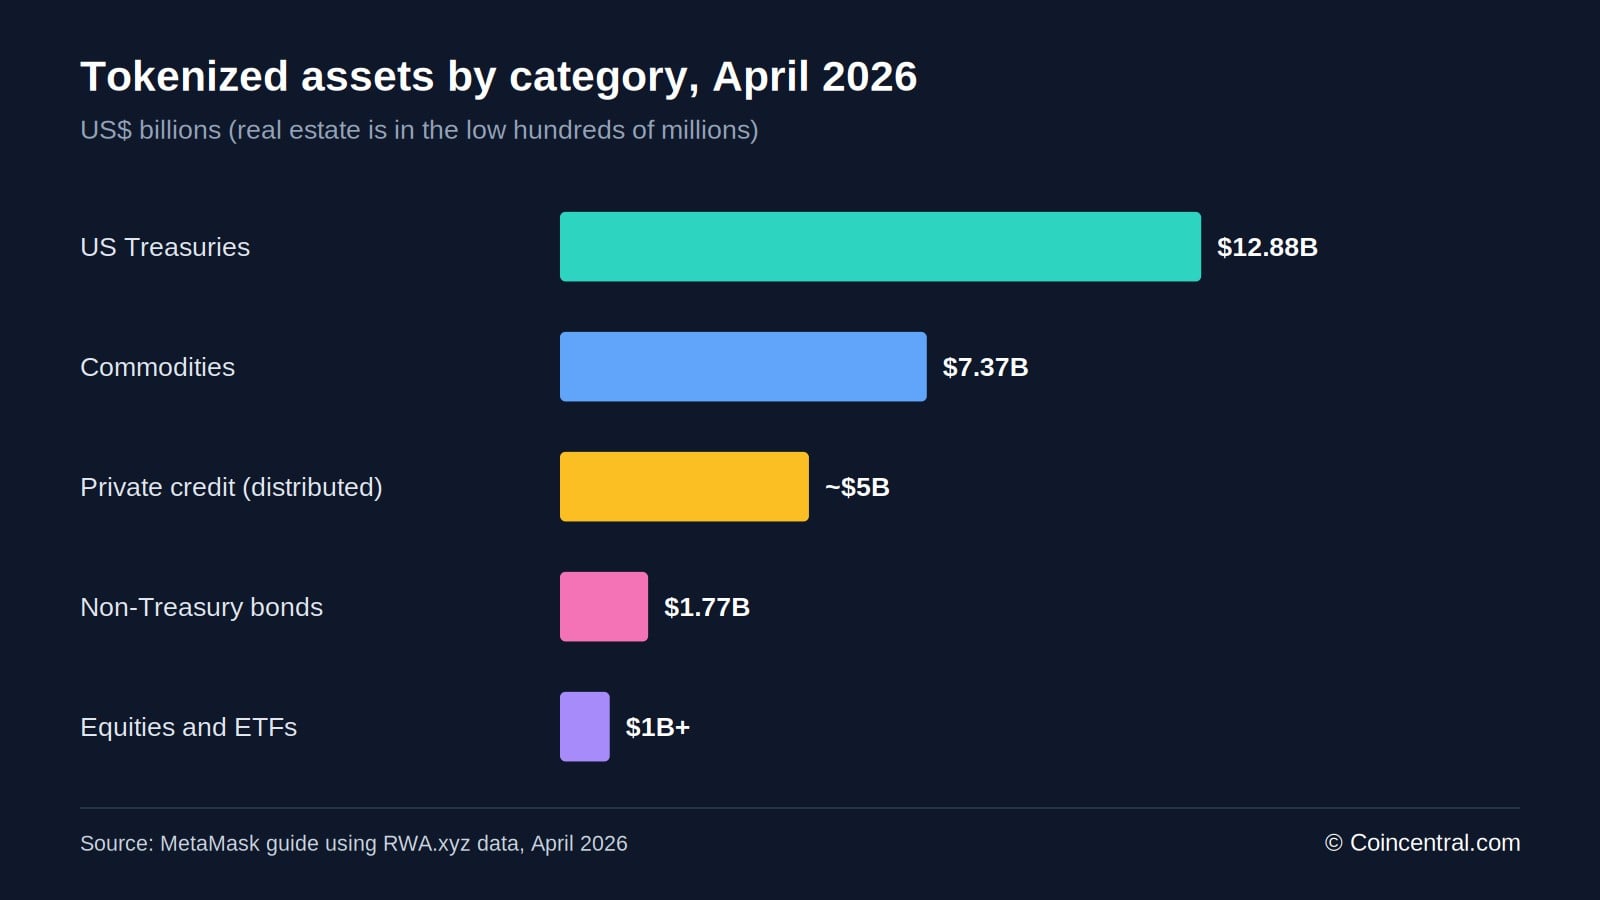 Figure 4: US Treasuries, commodities and private credit lead tokenized asset value as of April 2026.
Commodities are almost all gold. Tether Gold holds about $2.7 billion and Paxos Gold about $2.4 billion, together roughly 74% of the category. These tokens pay no yield, so returns depend on the gold price.
| US Treasuries | About $12.88B | 3% to 5% | High |
| Commodities | About $7.37B | None | Medium |
| Private credit | About $5B distributed | 8% to 15% | Low |
| Non-Treasury bonds | About $1.77B | 4% to 8% | Low to medium |
| Equities and ETFs | Over $1B | Market return | Medium |
| Real estate | Low hundreds of millions | 4% to 10% | Low |
Real estate is the smallest of the major categories. Learnsignal puts it at about $226 million, less than 1% of the tracked market. That stands out because real estate is one of the most cited use cases in industry commentary.
Forecasts for the category are far larger. Deloitte projects $4 trillion in tokenized real estate by 2035. The gap between that figure and today’s value shows how early the category is.
Higher yields come with higher risk. MetaMask noted that stress in the broader private credit market in March 2026 showed how weak loans can affect tokenized products. Lockup periods are common, and secondary market trading is thin.
Who Holds Tokenized Assets
The holder base is global. Chainalysis found that US holders make up 11.7% of the global tokenized RWA holder base and 11.4% of its value. Tokenized Treasuries break that pattern.
By value, Italy accounts for 29.9% of geolocated tokenized Treasury holdings. Portugal holds 18.8% and Singapore 18.2%, while the United States ranks fourth at 10.5%.
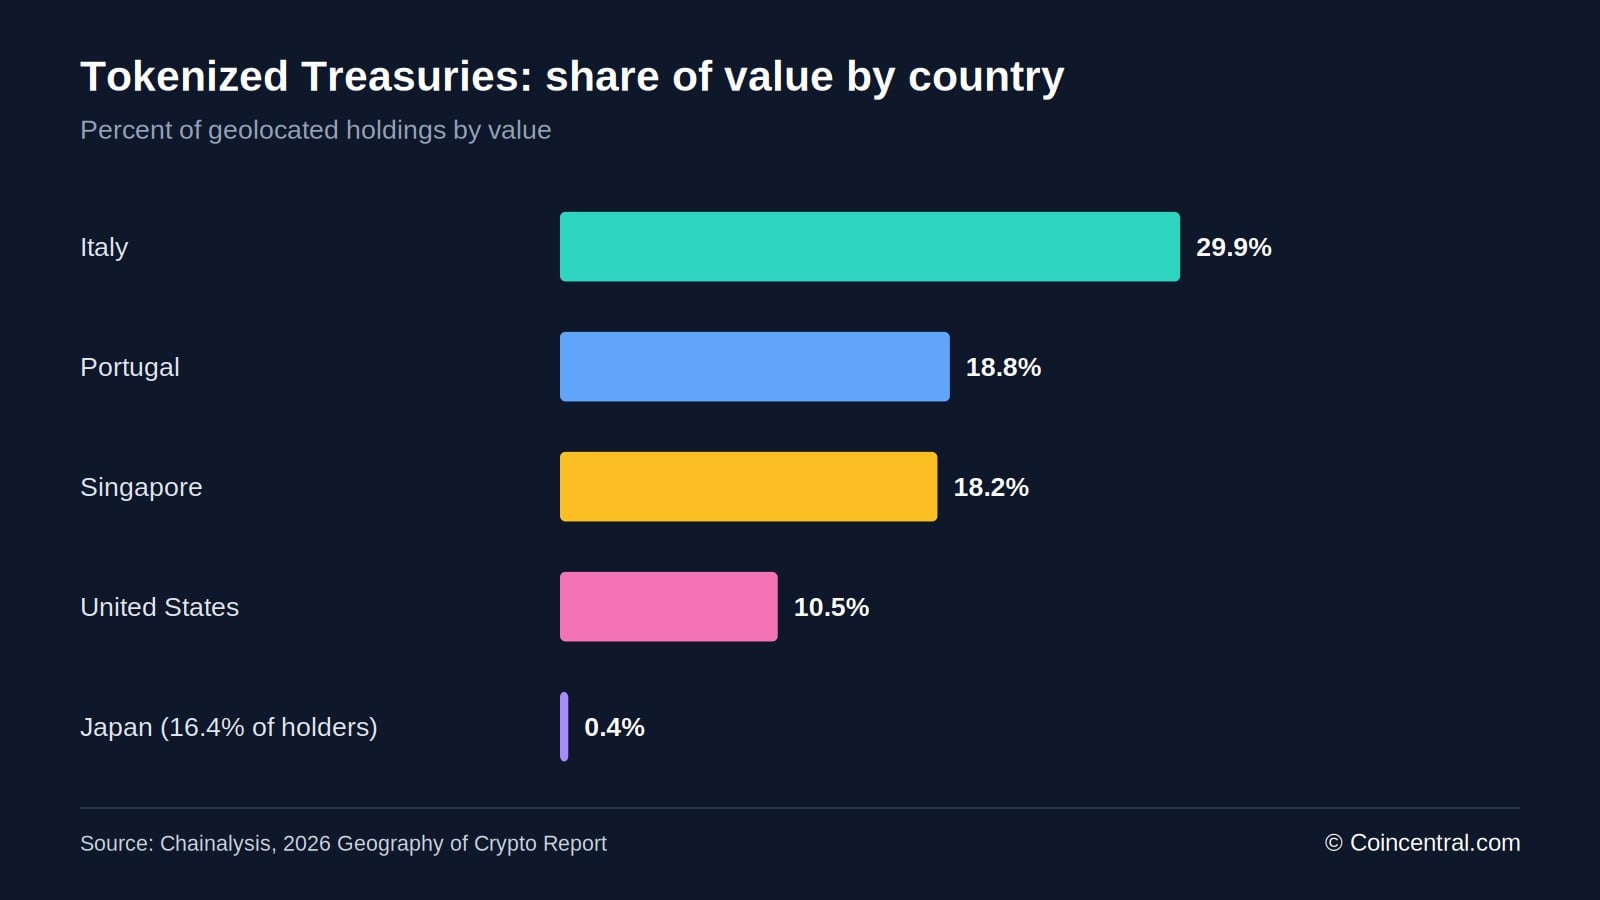 Figure 5: Italy, Portugal and Singapore hold the largest shares of tokenized Treasuries by value.
Holder counts tell a different story. Japan leads with 16.4% of holders but just 0.4% of the value. Chainalysis reads this as a small group of large foreign holders driving value, with a wider retail base building small positions.
| Italy | 29.9% | Largest by value |
| Portugal | 18.8% | Second by value |
| Singapore | 18.2% | Third by value |
| United States | 10.5% | Fourth by value |
| Japan | 0.4% | 16.4% of holders |
The issuers are mostly large traditional firms. Learnsignal lists BlackRock, Franklin Templeton, Apollo, Hamilton Lane and WisdomTree among the main builders. These are asset managers, not crypto startups.
Ethereum remains the main network. MetaMask reports that it hosts over 56% of all tokenized asset value as of April 2026. Stellar, Solana, Polygon, Avalanche, Arbitrum, Base and BNB Chain also host products.
Chainalysis adds a policy point. A holder outside the United States who buys a tokenized Treasury product creates demand for US government debt rather than for their own government’s debt.
Tokenization also changes who can buy. Chainalysis says it lowers the minimum position size and removes the need for a US brokerage relationship. A wholesale instrument becomes one that a retail holder in Lisbon or Singapore can buy directly.
Private Credit and On-Chain Lending
Lending data shows how people use tokenized assets. Dune found that credit assets make up about three-quarters of all real-world assets deposited in decentralized lending. Only a tiny fraction of tokenized Treasuries is used the same way.
Chainalysis reached a similar result. Private credit accounts for 77% of all value lent against tokenized RWAs. The number of wallets lending private credit grew 1,618% over the period.
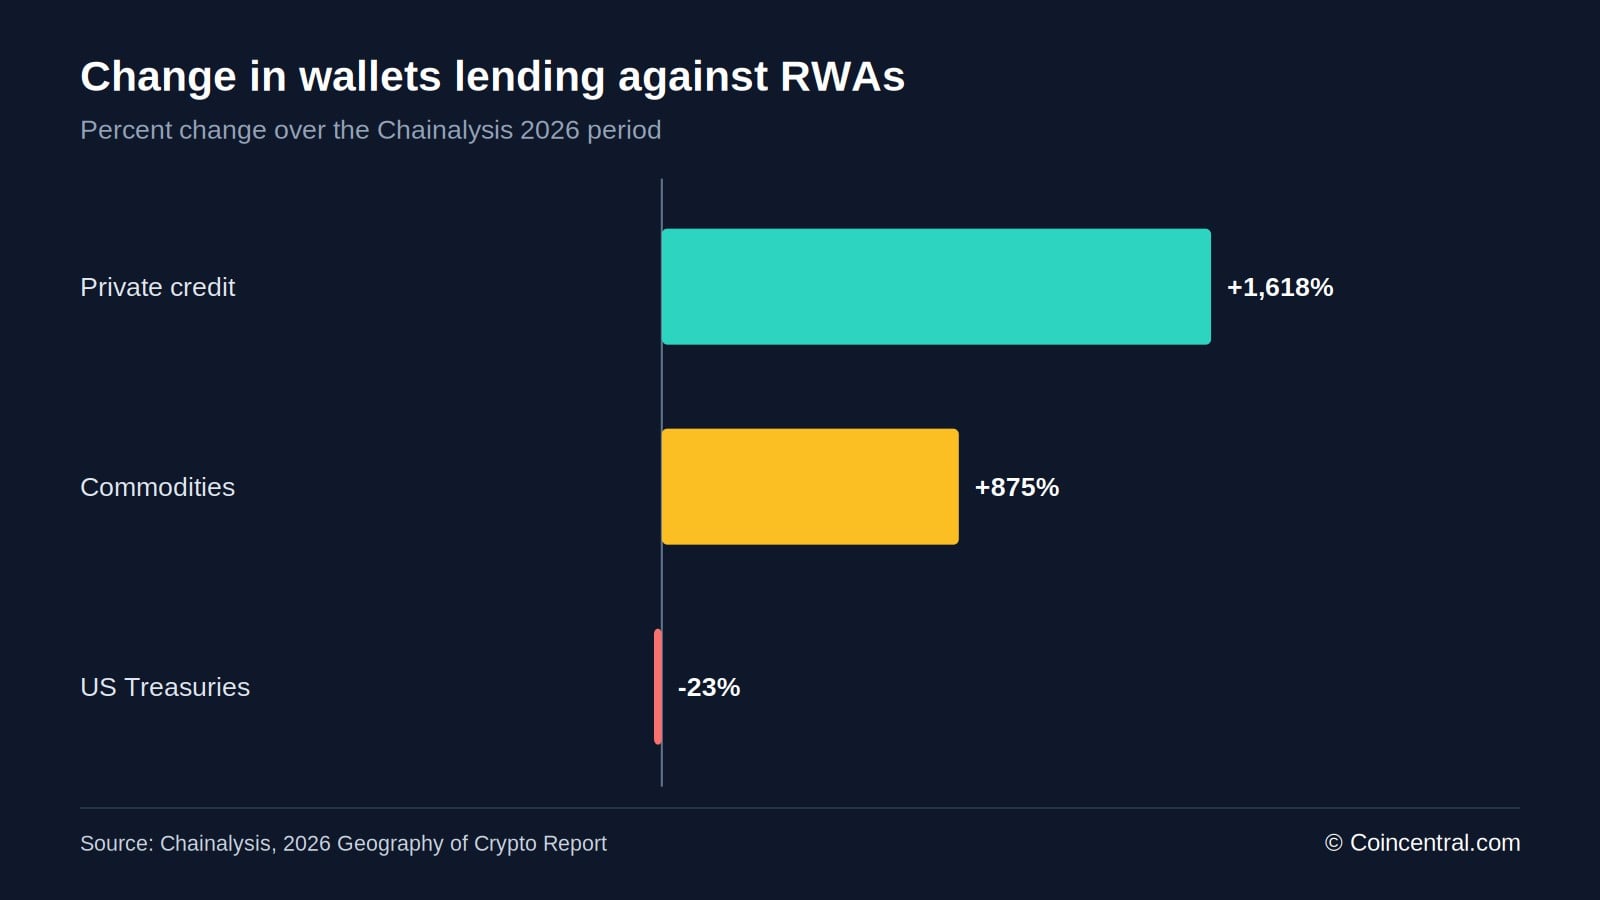 Figure 6: Private credit lending grew fast while Treasury lending fell.
Commodities lending grew 875%. Treasuries went the other way and fell 23%, the only category to contract. Chainalysis links the split to liquidity.
| Private credit | +1,618% | 77% |
| Commodities | +875% | Not reported |
| US Treasuries | -23% | Not reported |
Private credit is hard to sell in its untokenized form, so a token that can be posted as collateral is worth more to its holder. Treasuries are already the most liquid collateral in traditional finance. A holder who wants cash against them has established ways to get it.
Yield is another reason. Dune CEO Frederik Haga said tokenized private credit lets investors earn interest while using the same assets as collateral to borrow and fund other trades. MetaMask lists typical private credit yields of 8% to 15%.
Private credit also looks larger in some datasets. Bernstein, cited by CoinDesk, said about 47% of $51 billion in tokenized assets is private credit. That category often sits below the surface of public dashboards.
Tokenized Stocks and ETFs
Tokenized equities are small by value but growing fast in users. Insights4VC tracked distributed tokenized stocks rising from $951 million in March 2026 to $1.89 billion in July. Dune reported that active holders passed one million.
Other data points higher. A figure cited by OneBullEx shows holders rising from 103,000 in January to 1.9 million by September 2026. Ondo Finance’s stock platform reached $1 billion in total value locked in May 2026.
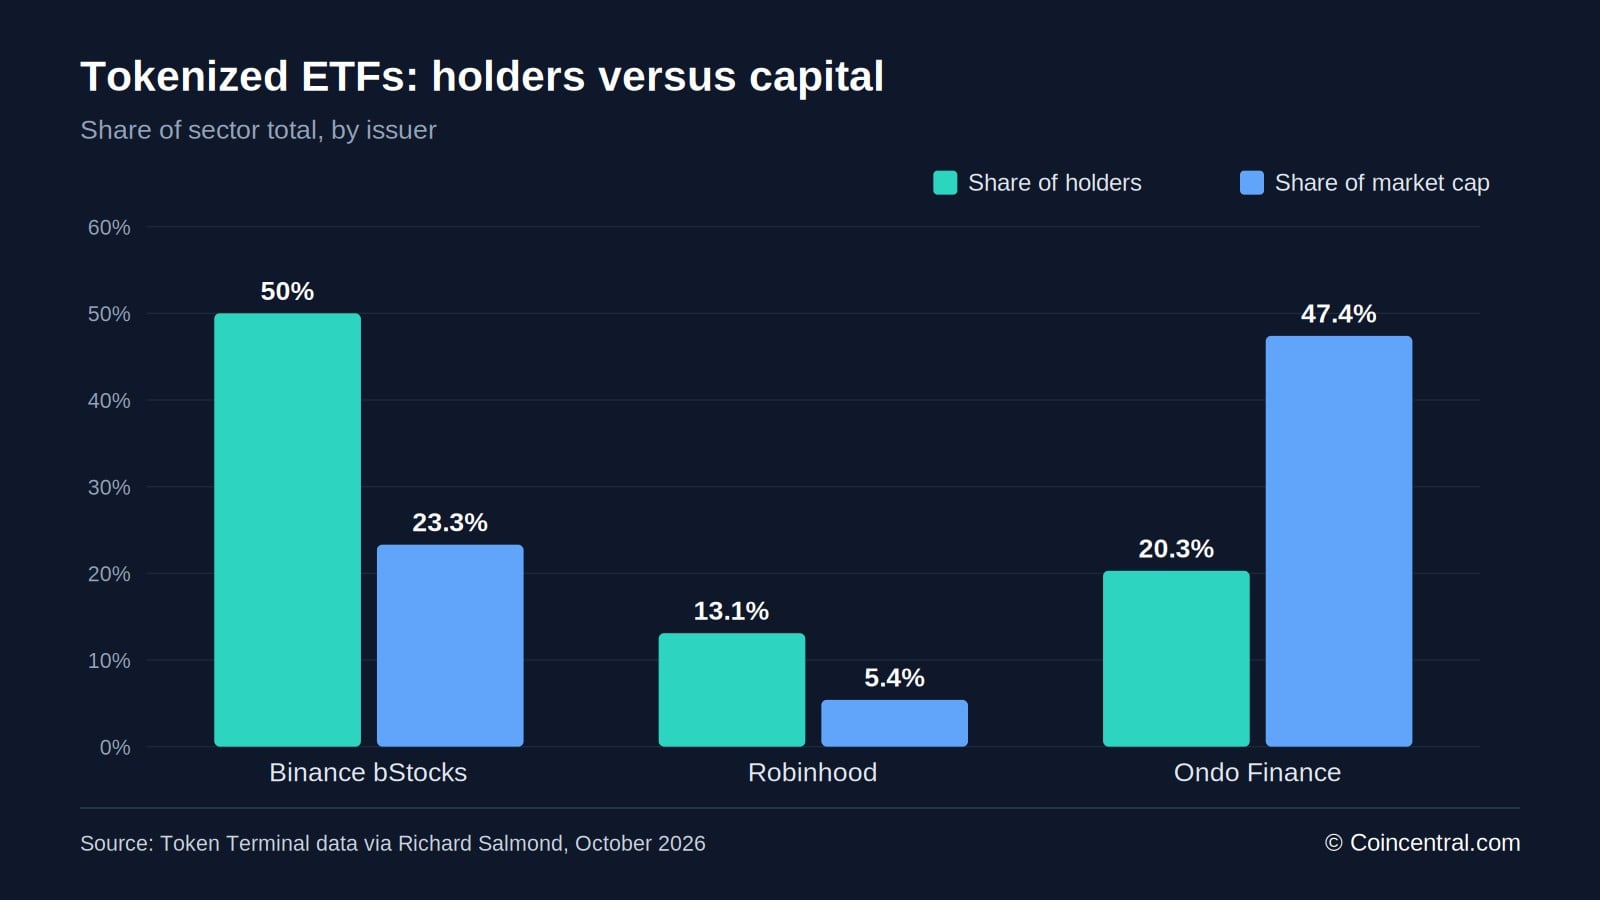 Figure 7: Binance has half of tokenized ETF holders but under a quarter of the capital.
Token Terminal data shows tokenized ETFs tripled in size this year. Market capitalization rose from $219 million on January 1 to $654 million. Holders of tokenized ETFs rose about 51-fold, while holders of individual tokenized stocks rose about 26-fold.
Binance bStocks has 448,400 holders, half of all tokenized ETF holders, but only 23.3% of market cap, or $160 million. Robinhood has 13.1% of holders and 5.4% of capital. Ondo Finance holds 47.4% of capital, or $325.7 million, from only 20.3% of holders.
| QQQb (Binance) | $67.6M | 314,500 holders, 35% of the total |
| SPYx | $62.2M | Tracks the S&P 500 |
| IVVon (Ondo) | $61.5M | Tracks the S&P 500 |
| Ethereum | $303M | 44.1% of tokenized ETF value |
| BNB Chain | $192.1M | 28% of tokenized ETF value |
Users prefer single companies over funds. Dune estimates that individual stocks make up 81% of tokenized equities held in spot markets, and their value grew ninefold in a year. On traditional markets, more than 6,000 US-listed ETFs now outnumber individual stocks.
The Token Terminal data also shows overlap. Products tracking the S&P 500 and Nasdaq-100 have a combined value of about $330 million, nearly half the sector total. Because several issuers offer similar exposure on different chains, demand for one index is split across near-identical tokens.
Liquidity is a limit. MetaMask notes that order books for most tokenized stocks are much thinner than for traditional shares. The SEC said on January 28, 2026, that existing securities laws apply whether ownership is recorded on-chain or off-chain.
Forecasts, Regulation and Risks
Long-term forecasts vary widely. BCG and ADDX project a $16.1 trillion opportunity by 2030. McKinsey’s base case is about $2 trillion in tokenized market capitalization by the same date.
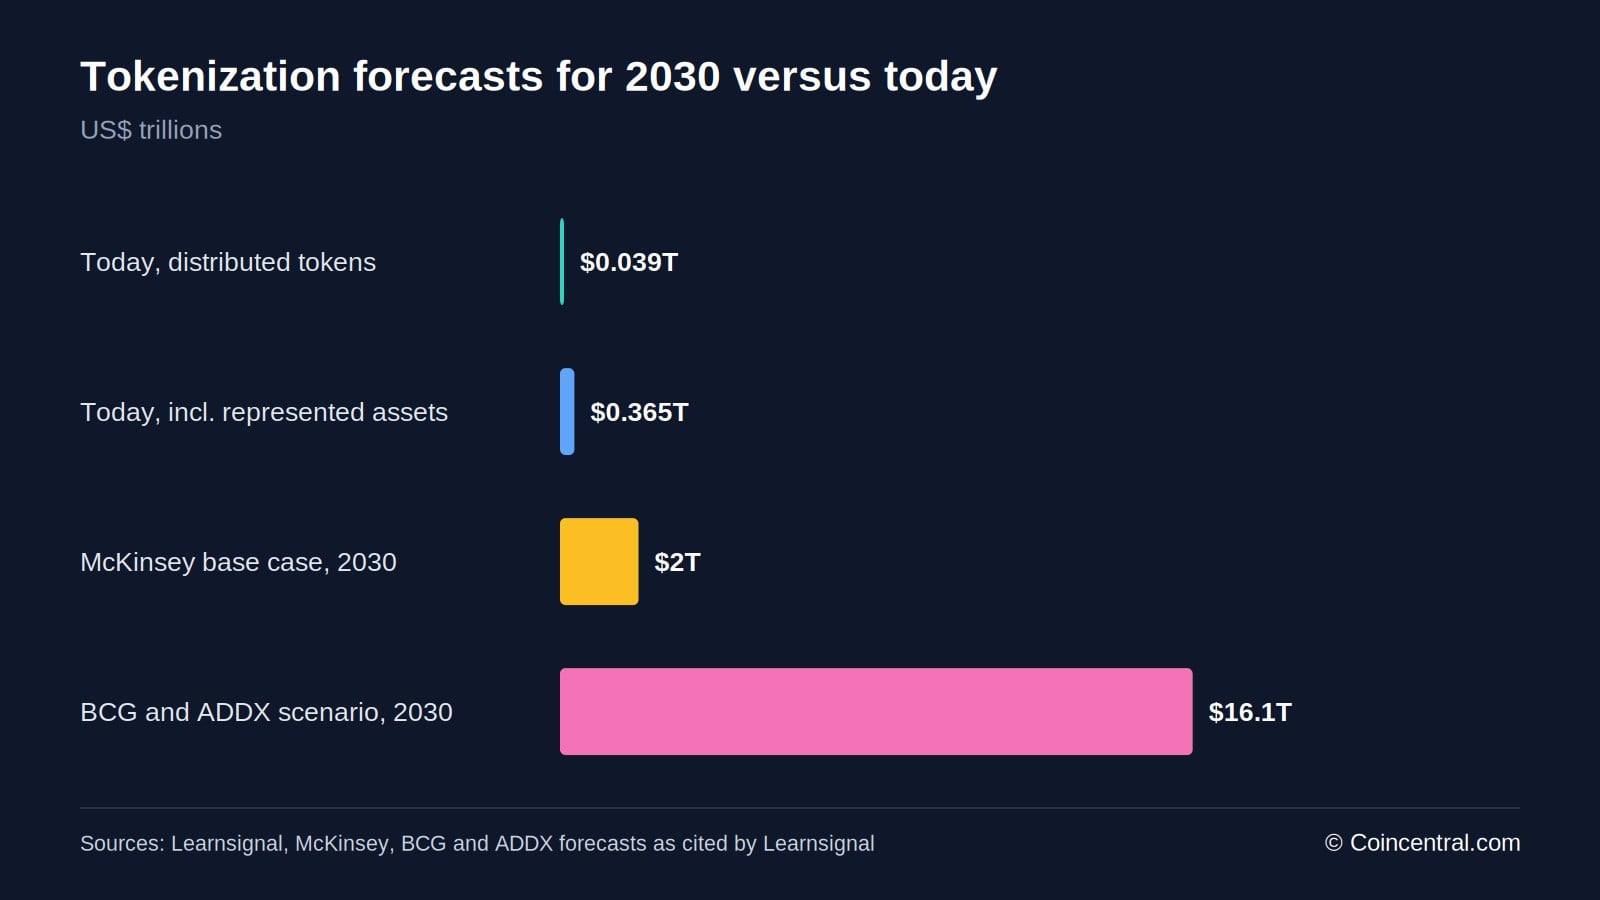 Figure 8: Two credible 2030 forecasts differ by about eight times.
That is a gap of about eight times between two institutional forecasts. Today’s distributed market is about $38.8 billion. Any single projection should be treated as an estimate, not a settled fact.
Rules differ by region. The US House Financial Services Committee held a hearing on March 25, 2026, on the Modernizing Markets Through Tokenization Act of 2026. No comprehensive federal framework exists, and the SEC works case by case, including the Franklin Templeton relief and a pending Ondo filing.
The EU treats tokenized securities as financial instruments under existing law and licenses service providers under MiCA. OneBullEx describes this as clearer, though demanding. Firms that operate across borders face questions about which rules apply.
| Concentration | Yellow.com found 80% of value sits in a handful of protocols and funds |
| Liquidity | An arXiv study found asset value grew faster than trading volume |
| Custody | SEC treatment of tokenized securities custody is unresolved |
| Fragmentation | Funds sit on separate chains, and bridges add security risk |
The risks are practical. An arXiv study of December 2025 to May 2026 found signs of illiquidity in some tokenized markets. Tokenized funds are also spread across networks that cannot share collateral without a bridge.
Infrastructure may drive the next phase. The NYSE has announced plans for 24/7 trading and instant settlement. Franklin Templeton is working with DigiFT and Binance on wider institutional use.
What the Statistics Show
The tokenized RWA market is real and growing, but it is still narrow. Distributed value sits in the range of $30 billion to $40 billion on most trackers, and Treasuries account for about 40% of it. Private credit comes next, while real estate is under 1%.
Growth is fastest in stocks and ETFs, driven by retail users on large platforms. Capital still sits with a smaller group of large holders. The gap between holder counts and dollars is a pattern across ETFs, Treasuries and stocks.
Forecasts for 2030 range from $2 trillion to $16.1 trillion. Readers should compare sources carefully, because each tracker defines the market differently. This article is for information only and is not financial advice.
Several events could change the picture in the coming months. These include the SEC response to Ondo’s filing, Franklin Templeton’s plan to place BENJI inside traditional funds, and whether NYSE round-the-clock trading leads to tokenized listings. Each would change how easily assets move between old and new markets.
Sources
- Real-World Asset Tokenization Explained: Where the Market Actually Stands in 2026 (Learnsignal)
- North America: Inside the Growth of Agentic Commerce (Chainalysis)
- RWA categories in 2026: tokenized Treasuries, stocks, commodities, and more (MetaMask)
- New report finds that rapid expansion of tokenization is giving rise to new styles of investing (Fortune)
- Tokenized ETFs Triple in Size as Retail Adoption Outpaces Capital Growth (Richard Salmond)
- Tokenized Treasuries Drive RWA Market Past $30 Billion In Early 2026 (OneBullEx)
- Stablecoins & Tokenized Assets Report March 2026 (CoinDesk Data)
The post Tokenized Real-World Assets Statistics 2026: Market Size, Growth and Top Asset Classes appeared first on Blockonomi.








 English (US) ·