
Key Takeaways
- A monthly cup and handle pattern is developing on SOL charts following its recovery from 2022 bear market lows
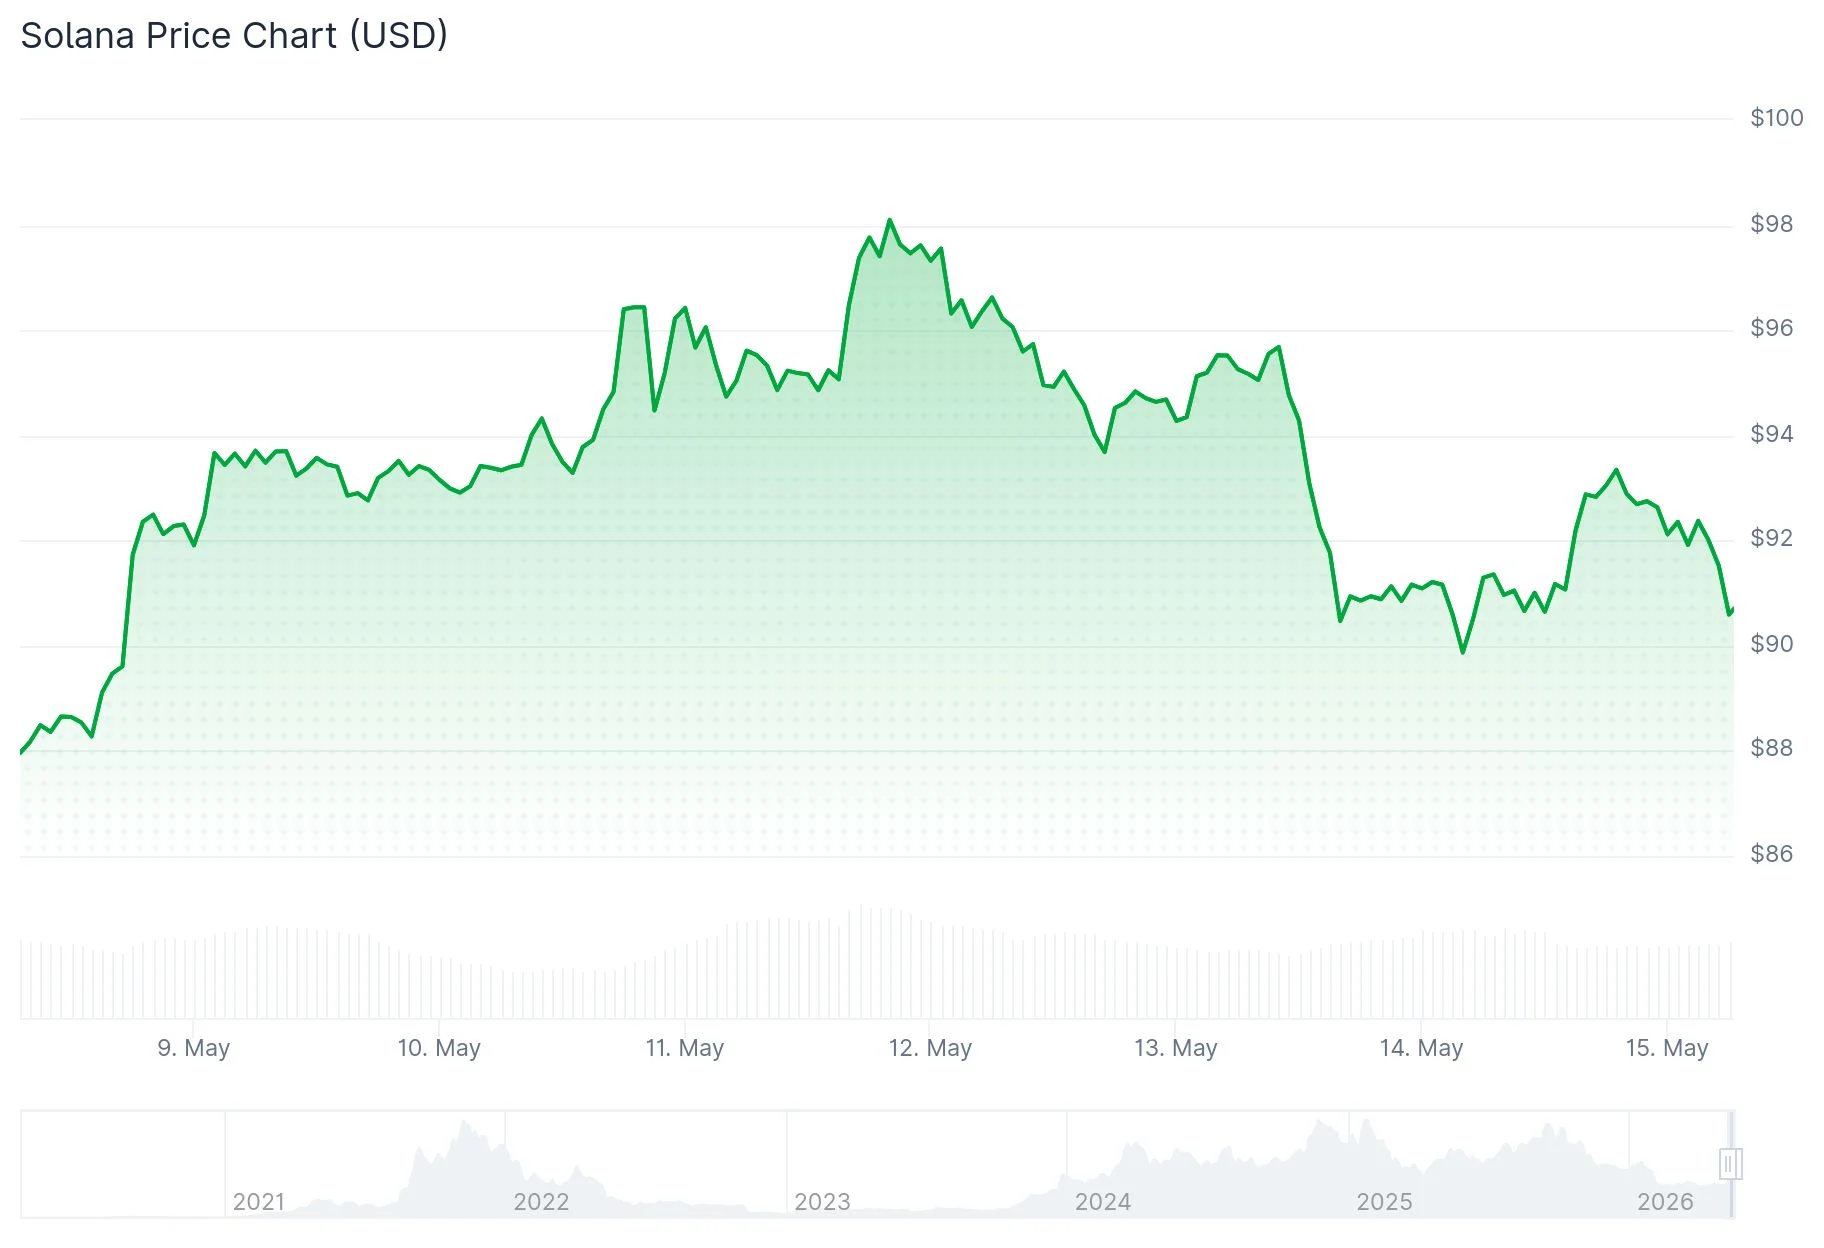
- Price action has been confined to a $78–$98 range since February, with $88 serving as a critical pivot
- Technical analyst Ali Charts highlights that a daily close above $98 could target $107 followed by $117
- SOL successfully broke above a multi-year descending channel and is now consolidating between $92–$95
- Critical support zones sit at $92, $89, and $78 — a breakdown below $78 would compromise the bullish thesis
Solana continues to maintain position above critical support zones as a significant monthly cup and handle formation takes shape. The technical setup remains favorable, though validation requires SOL to protect support levels and breach the $98 resistance threshold.
 Solana (SOL) Price
Since early February, SOL has oscillated within a defined channel featuring support at $78 and resistance at $98. Technical analyst Ali Charts mapped these boundaries, noting that $88 functions as the midpoint pivot.
SOL attempted to challenge the $98 resistance level recently but faced swift rejection. Ali Charts observed that price has rebounded from lower levels, indicating potential for another attempt at the $98 ceiling.
According to Ali Charts, a confirmed daily close beyond $98 would likely propel SOL toward an initial target of $107, followed by a secondary objective at $117. Should $98 maintain its role as resistance, expect potential retracement to $88 or a deeper correction toward $78.
$98 is the level that could signal a bullish breakout for Solana.
Since February, $SOL has been moving within a well-defined channel. I’ve identified the boundaries at $78 (Floor) and $98 (Ceiling), with $88 as the current pivot point.
We recently tested that $98 resistance,… pic.twitter.com/E1ntBJZHZH
— Ali Charts (@alicharts) May 14, 2026
Large-Scale Cup and Handle Formation Takes Shape
On the monthly timeframe, analyst Bitcoinsensus has identified an expansive cup and handle pattern. SOL declined from its 2021 peak, established a bottom throughout 2022 and 2023, then rallied back toward previous resistance zones.
The handle portion is currently materializing as a sideways consolidation period. SOL is trading near the lower boundary of this handle, establishing this trendline as a crucial zone for bulls to maintain.
This pattern remains unconfirmed at present. SOL must clear the upper handle trendline and penetrate broader resistance near 2021 highs before the formation becomes validated.
Multi-Year Descending Channel Violation
Analyst CryptoXLARG highlighted that SOL has escaped from a prolonged descending channel structure. Price currently consolidates within the $92–$95 zone as it establishes a foundation for potential trend continuation.
$SOL has broken out of a long-term descending channel and is now consolidating around the $92–$95 range, signaling a potential trend reversal after a broader base formation.
A sustained move above $95 is key. If confirmed, the next targets are $102.70 followed by $106.50 and… pic.twitter.com/6JyagUMOgF
— 𝐂𝐫𝐲𝐩𝐭𝐨𝐗𝐋𝐀𝐑𝐆𝐄 (@CryptoXLARG) May 13, 2026
A confirmed move beyond $95 would activate targets at $102.70, $106.50, and $118.26. Under favorable momentum conditions, CryptoXLARG projects macro-level targets extending to $143 and potentially $163.
Analyst Bitcoin Meraklısı observed that SOL achieved its initial upside objective following an approximately 10% breakout rally before encountering seller pressure. A pullback toward $92 remains consistent with healthy price structure.
$92 represents the nearest support foundation. Below that level, watch for $89 and $78 as subsequent zones. A breach below $78 would negate the current constructive technical framework.
Analyst Moe highlighted that SOL has reclaimed territory above a long-term descending trendline dating back to the 2021 peak, indicating the broader downtrend structure has deteriorated. SOL maintains its position above this reclaimed trendline.


 English (US) ·