
 1 hour ago
12
1 hour ago
12
Key Highlights
- Ethereum surged from approximately $1,800 to nearly $1,945, currently hovering around $1,929
- Strong equity market performance and $37.47M in spot ETF inflows sparked renewed buying interest
- Technical analyst Ted Pillows highlights that maintaining the $1,870–$1,900 range is critical for a breakout above $2,000
- The ETH/BTC pair has successfully broken free from an 11-month declining trendline, with analysts watching 0.032–0.035 BTC levels
- Failure to maintain support above $1,859 could trigger a pullback toward $1,828
Ethereum has experienced a notable upward surge during the past day, rallying from the $1,800 level to touch an intraday peak near $1,945. Currently, ETH is changing hands around $1,929, marking approximately 6% gains from its recent bottom on July 21.
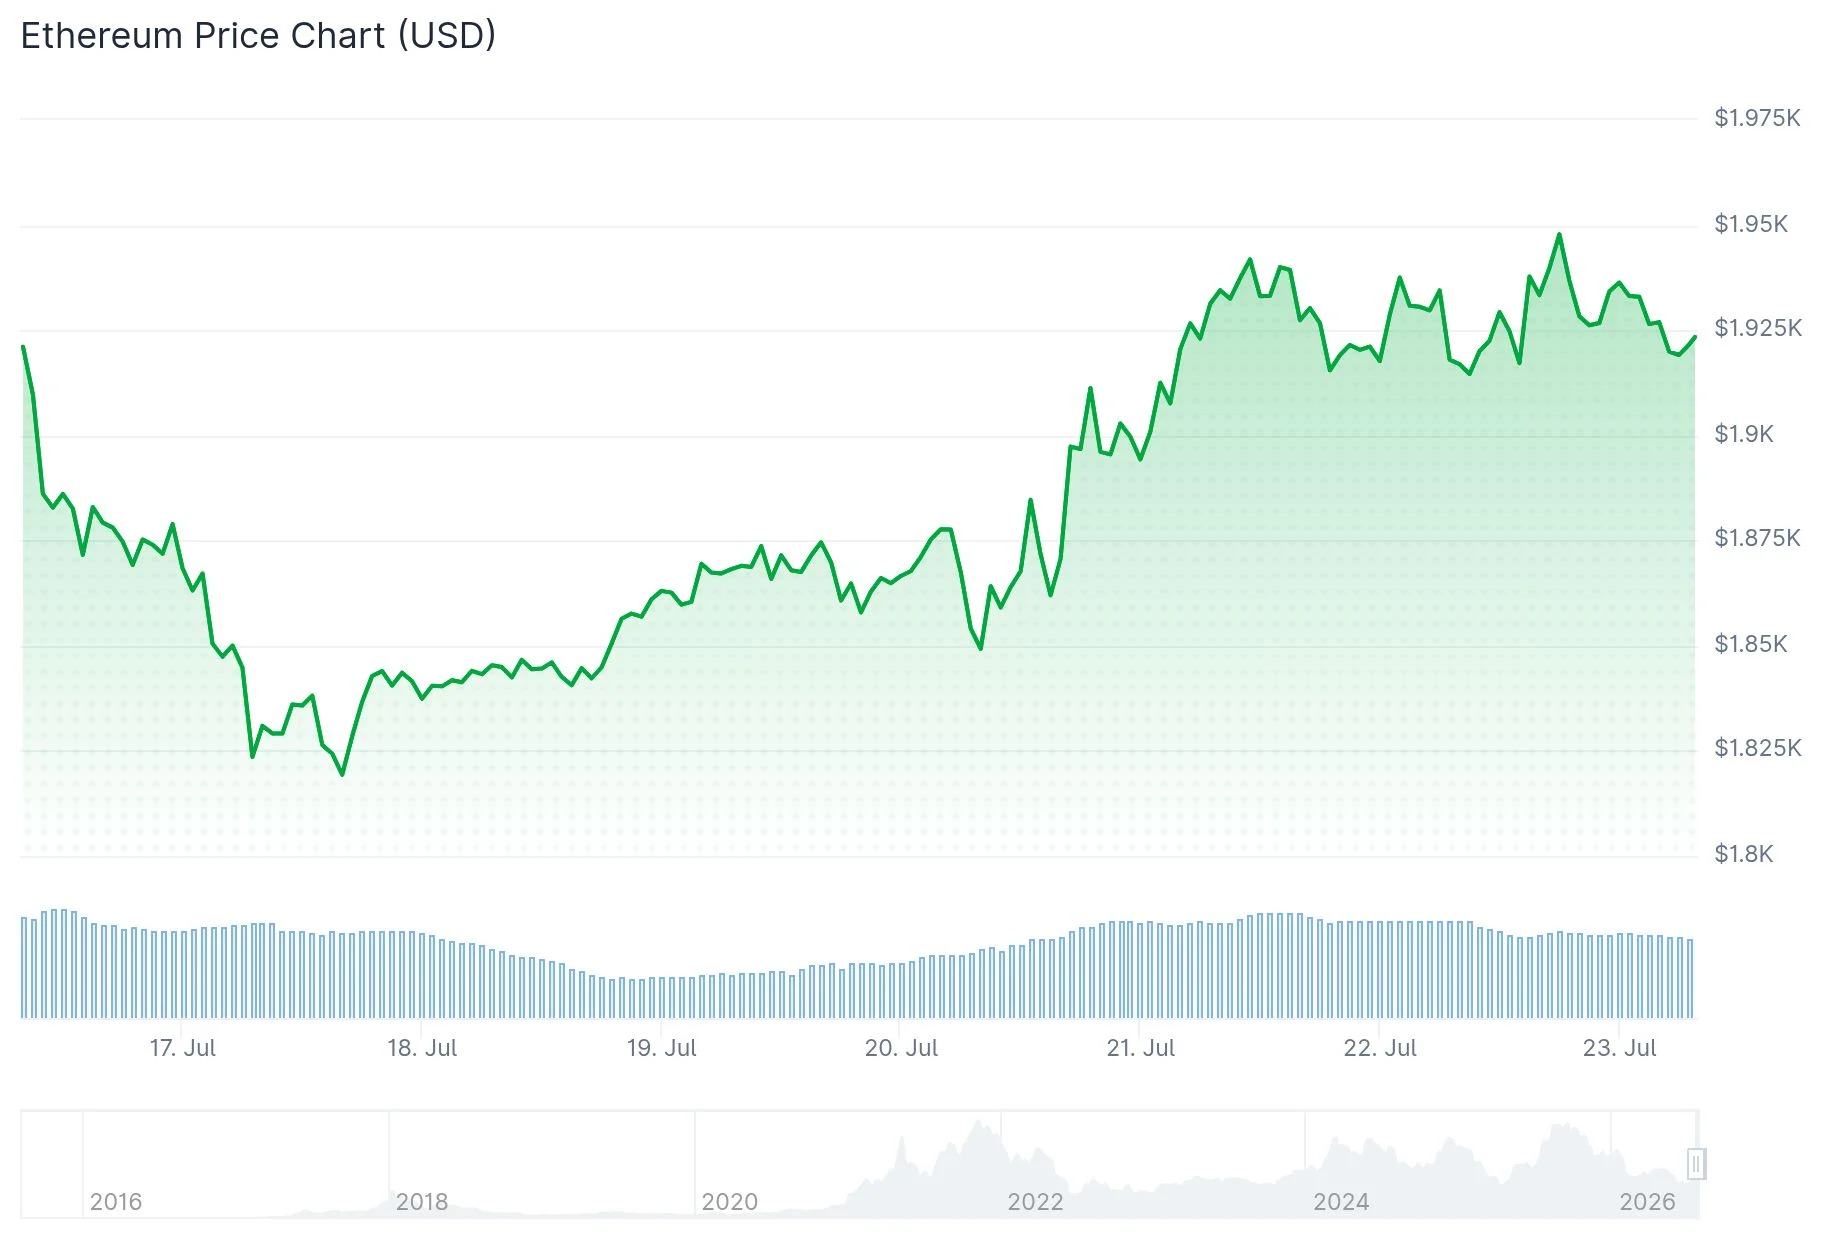 Ethereum (ETH) Price
This upward momentum coincided with a robust performance across U.S. equity markets. The Nasdaq Composite index advanced 1.3% while the S&P 500 climbed 0.9%, propelled by strength in semiconductor and artificial intelligence sectors. Micron’s shares surged 12.2% and Nvidia posted a 2% gain, enhancing overall market sentiment toward risk assets.
Investment flows into spot Ethereum ETFs further bolstered bullish momentum. Data from SoSoValue indicates that U.S.-based spot Ethereum exchange-traded funds attracted $37.47 million in net inflows during the most recent trading session. BlackRock’s ETHA product dominated with $52.7 million in fresh capital, though this was somewhat counterbalanced by withdrawals from Fidelity’s FETH offering.
From a technical perspective, ETH has been moving within an upward-sloping channel pattern established since its late-June trough near $1,514. The 20-day simple moving average, positioned at $1,828, has provided consistent support throughout this recovery phase.
Critical Resistance Zone Between $1,945 and $2,000
The immediate challenge for Ethereum lies in the $1,945–$1,953 resistance band. Price action has approached this zone on two occasions without achieving a definitive daily close above it. According to 4-hour Fibonacci analysis, the complete recovery target sits at $1,953.
Should ETH successfully breach $1,953 on a closing basis, the next obstacle emerges at the 100-day SMA around $1,981, with the psychologically significant $2,000 milestone just beyond. CoinGlass liquidation data reveals concentrated short position clustering between $1,950 and $1,960, suggesting that a decisive break could trigger cascading liquidations and accelerate upward momentum.
Market analyst Ted Pillows emphasized the importance of the $1,870–$1,900 support zone. In his assessment: “Should the $1,870–$1,900 level remain intact, Ethereum has the potential to rally beyond $2,000 in short order.”
Trader Daan Crypto Trades observed that ETH has demonstrated superior performance relative to BTC during Q3, posting gains of 22.98% versus the 8.86% historical quarterly average. He emphasized that this recovery follows Ethereum’s most challenging first-half performance since 2022. However, he cautioned that “BTC will have to lead the market though,” underscoring Bitcoin’s traditional role as the catalyst for broader cryptocurrency market movements.
ETH/BTC Ratio Escapes 11-Month Downtrend
Technical analyst Ted Pillows shared on X that the ETH/BTC trading pair has successfully escaped an 11-month descending trend pattern, stating “Ethereum could start outperforming Bitcoin heavily now.”
Analyst MikybullCrypto verified that Ethereum has recaptured its weekly bull market support band relative to Bitcoin. Meanwhile, Daan Crypto Trades emphasized that a sustained advance above the 0.03 BTC threshold would validate the breakout, with subsequent resistance targets identified at 0.032 and 0.034 BTC. The ETH/BTC pair currently trades beneath the 0.03 level, indicating the breakout requires additional confirmation.
Should ETH experience a decline below $1,859, traders should monitor support levels at $1,828 and $1,785.
The post Ethereum (ETH) Price Surges Past $1,900 as 11-Month Bitcoin Downtrend Ends appeared first on Blockonomi.








 English (US) ·