
 2 hours ago
13
2 hours ago
13
Key Takeaways
- BTC finished the week above its 50-week moving average for the first time in 45 weeks, settling near $81,159.
- Research from Galaxy indicates that 11 out of 13 historical weekly reclaims of this metric did not result in new cycle lows.
- Bitcoin has surged approximately 29% during the past 35 days and achieved its strongest weekly close in four months.
- Market observers are monitoring whether BTC can sustain support above the moving average, currently positioned around $78,000.
- Analyst Ted suggests that a breakout beyond $83,000 would validate the cycle low and presented a potential trajectory for Bitcoin through the next two to three years.
Bitcoin has achieved a significant technical milestone by finishing the week above its 50-week moving average for the first time in 45 weeks, drawing attention to this crucial long-term price metric.
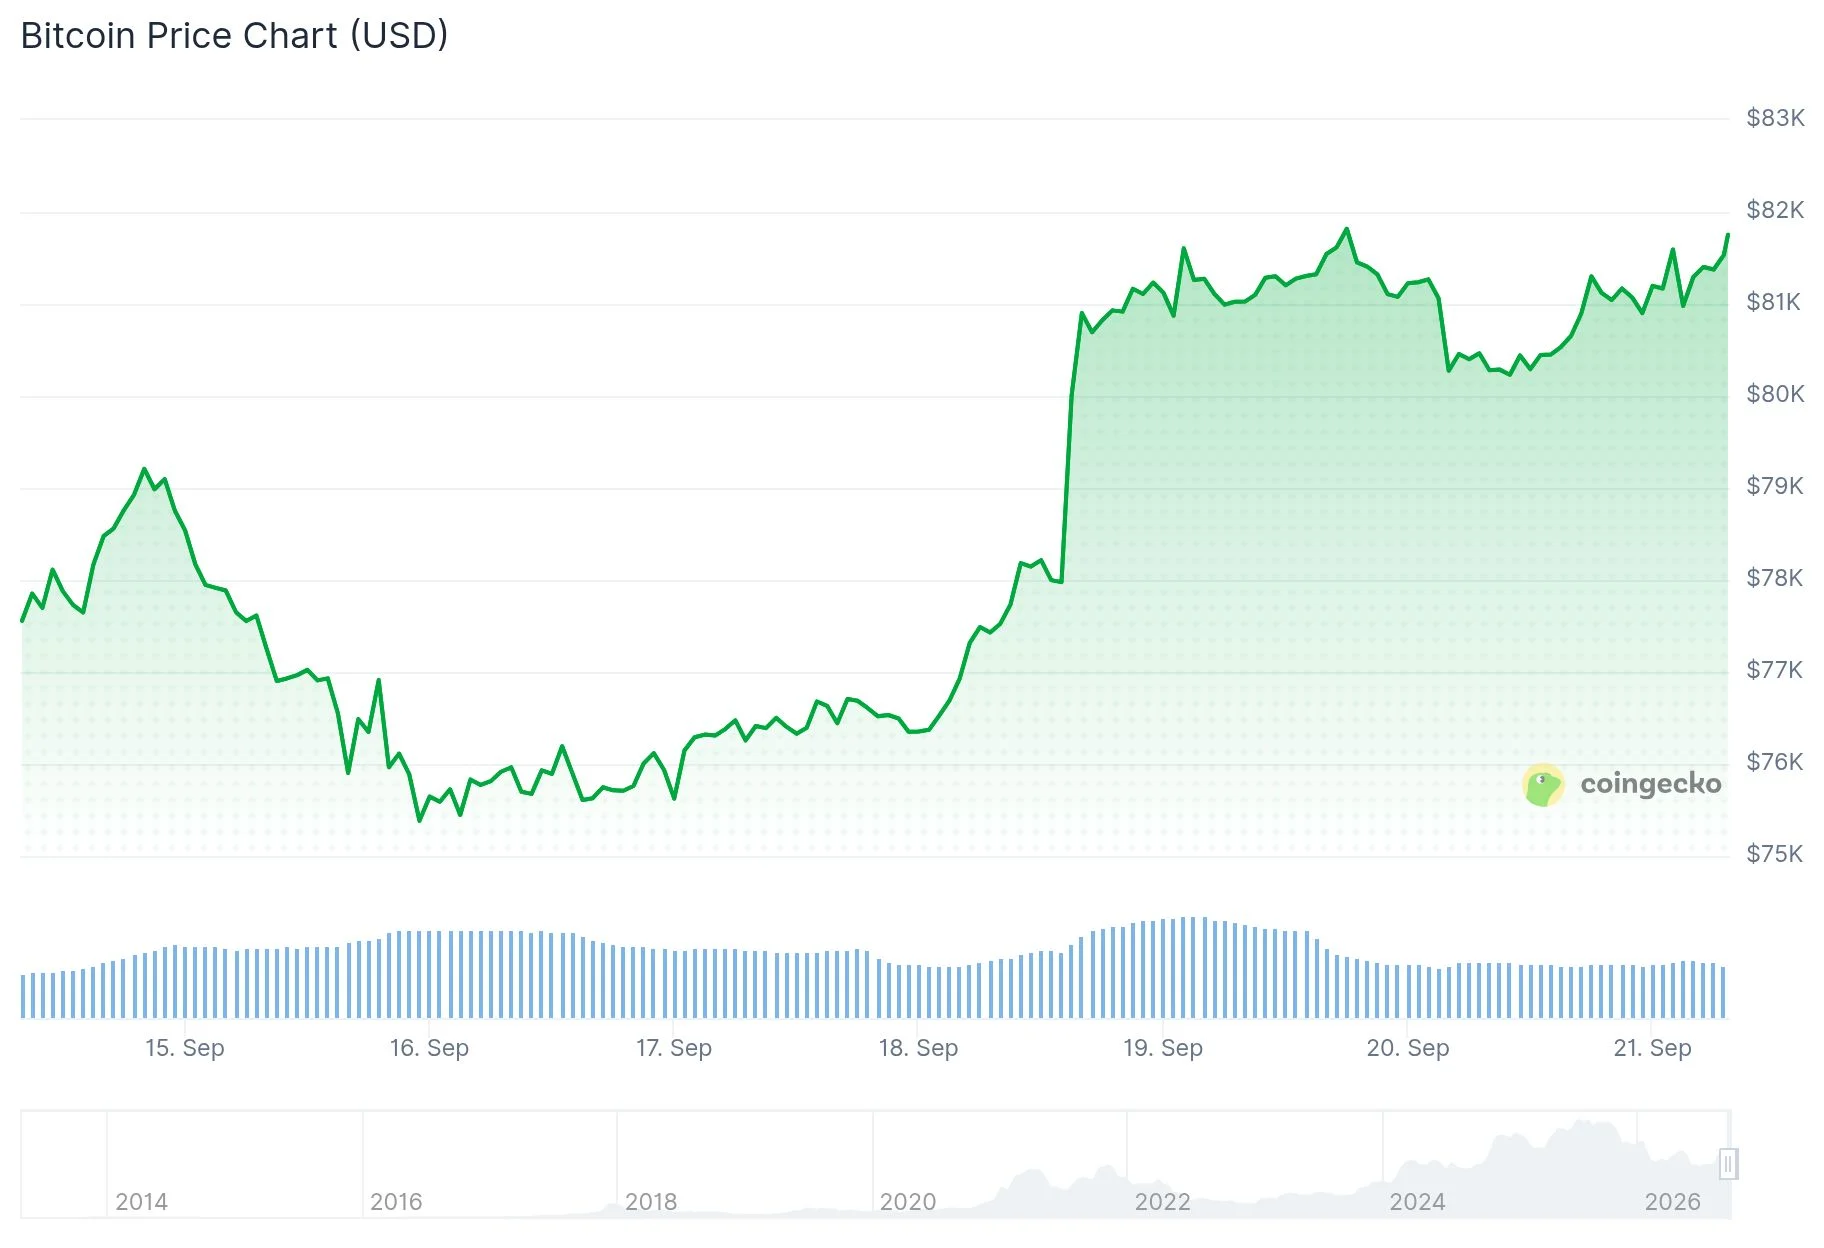 Bitcoin (BTC) Price
The leading cryptocurrency concluded Sunday’s trading session at approximately $81,159 on Coinbase, positioned above its 50-week moving average of roughly $78,788. This marked BTC’s strongest weekly finish in the past four months.
During the week, the digital asset appreciated by nearly 6%. Over the last 35 days, Bitcoin has experienced an impressive rally of approximately 29%.
Rather than merely piercing through resistance temporarily, Bitcoin’s weekly candle closed decisively above the moving average. Technical analysts frequently rely on weekly closes to evaluate longer-term market trends and momentum.
Historical Performance of Bitcoin’s 50-Week Moving Average
The 50-week moving average calculates Bitcoin’s mean weekly closing price across approximately 12 months. Throughout previous bear cycles, this metric has frequently served as a significant resistance level.
Alex Thorn, research head at Galaxy, has characterized this indicator as a barrier that Bitcoin has historically found challenging to surpass during prolonged downtrends.
Galaxy’s analysis examined 13 instances where Bitcoin successfully reclaimed the 50-week average. In 11 of these cases, BTC avoided establishing a new cycle bottom afterward.
Historical successful reclaims took place in January 2012, October 2015, May 2019, and March 2023. Each instance followed substantial Bitcoin market corrections.
The March 2023 breakthrough came after Bitcoin’s 2022 bottom around $15,500. BTC subsequently climbed to a record high near $126,000 in October 2025.
However, the indicator hasn’t been infallible. Reclaims during December 2021 and March 2022 preceded additional declines, with Bitcoin ultimately dropping toward the $16,000 level.
Ryan Lee, chief analyst at Bitget, noted that this recent close bolsters the argument that Bitcoin’s rebound is gaining traction. Nevertheless, he emphasized that additional weekly closes and ascending support levels would offer stronger validation.
Traders Focus on $83,000 as Bitcoin’s Next Critical Threshold
Multiple market participants are now directing attention toward $83,000 beyond just the moving average.
Cryptocurrency trader Craig Cobb indicated that clearing $83,000 would eliminate the lower high pattern on Bitcoin’s monthly chart, signaling that the extended downtrend would be invalidated.
Cobb is also tracking Bitcoin’s three-month candle formation. He explained that the historical red-to-green quarterly transition pattern he observes has generated new all-time highs in 11 of the previous confirmed occurrences.
Analyst Ted posted a comparable target on X. Ted indicated that Bitcoin surpassing $83,000 would establish the cycle bottom, and he detailed the price progression he anticipates for BTC during the coming two to three years.
Bitcoin was currently changing hands between $81,450 and $81,700, maintaining its position above the 50-week moving average while remaining beneath the $83,000 threshold that multiple traders are monitoring closely.
The post Bitcoin (BTC) Surges Past Critical 50-Week Moving Average After 45 Weeks appeared first on Blockonomi.




 English (US) ·