
TLDR:
- Bitcoin death cross forms on daily charts with moving averages positioned far above current price
- Weekly close below $69K-$72K support could trigger next leg down into deeper correction territory
- Binance withdrawal data shows whale accumulation doubled to 13.3 BTC average since late January
- Price must reclaim $82K then mid-$90Ks to establish bottoming pattern and reverse bearish trend
Bitcoin faces a critical test as price slides into the $69,000 to $72,000 support zone amid mounting bearish technical signals.
A death cross has formed on daily charts while weekly moving averages remain far overhead. Traders warn that a clean weekly close below this range could trigger a deeper correction phase.
The current price action shows weak bounce attempts with consistent rejections at key resistance levels.
Death Cross Formation Signals Bearish Trend Structure
The technical setup has deteriorated significantly as BTC continues its descent from higher levels. Daily charts now display an active death cross with the 50-day and 200-day moving averages positioned miles above current price. This configuration represents a classic bearish trend structure where rallies meet aggressive selling pressure.
Weekly timeframes confirm the concerning technical picture. Price remains trapped below the exponential moving average ribbon with repeated rejection attempts at that level.
Any upward moves are functioning as retests rather than genuine reversals. Trader @DamiDefi emphasized that pumps are getting sold while supports face continuous stress tests.
$BTC update, this is basically the exact continuation of the “death cross + lost weekly EMA ribbon” warning I posted.
The bounce attempts have been weak, and price has now slid all the way into that $69K–$72K band, the level that decides whether this is just a nasty shakeout or… https://t.co/bZw17hrcMh pic.twitter.com/rZed8M6JyT
— Dami-Defi (@DamiDefi) February 9, 2026
The $69,000 to $72,000 band now represents the final line of defense. This zone determines whether the market experiences a temporary shakeout or enters a prolonged correction phase. Price behavior at this level will dictate the trajectory for coming weeks and potentially months.
A breakdown below $69,000 on a weekly closing basis would open the next leg down. The accumulation phase would become considerably more painful before any bullish momentum could rebuild.
Historical patterns suggest that losing major support zones often leads to cascading liquidations and accelerated downside movement.
Support Test Occurs Despite Whale Buying Activity
The bearish price action persists even as on-chain data reveals unusual buying patterns. Binance exchange metrics show a significant increase in average withdrawal sizes during the decline.
The 14-day simple moving average of mean outflows has doubled from approximately 6 BTC on January 28 to 13.3 BTC by February 8.
This withdrawal pattern indicates whale and institutional activity at current price levels. Large entities appear to be accumulating Bitcoin around $69,000 despite the technical deterioration.
The average outflow size represents the highest level recorded since November 2024, according to CryptoOnchain data.
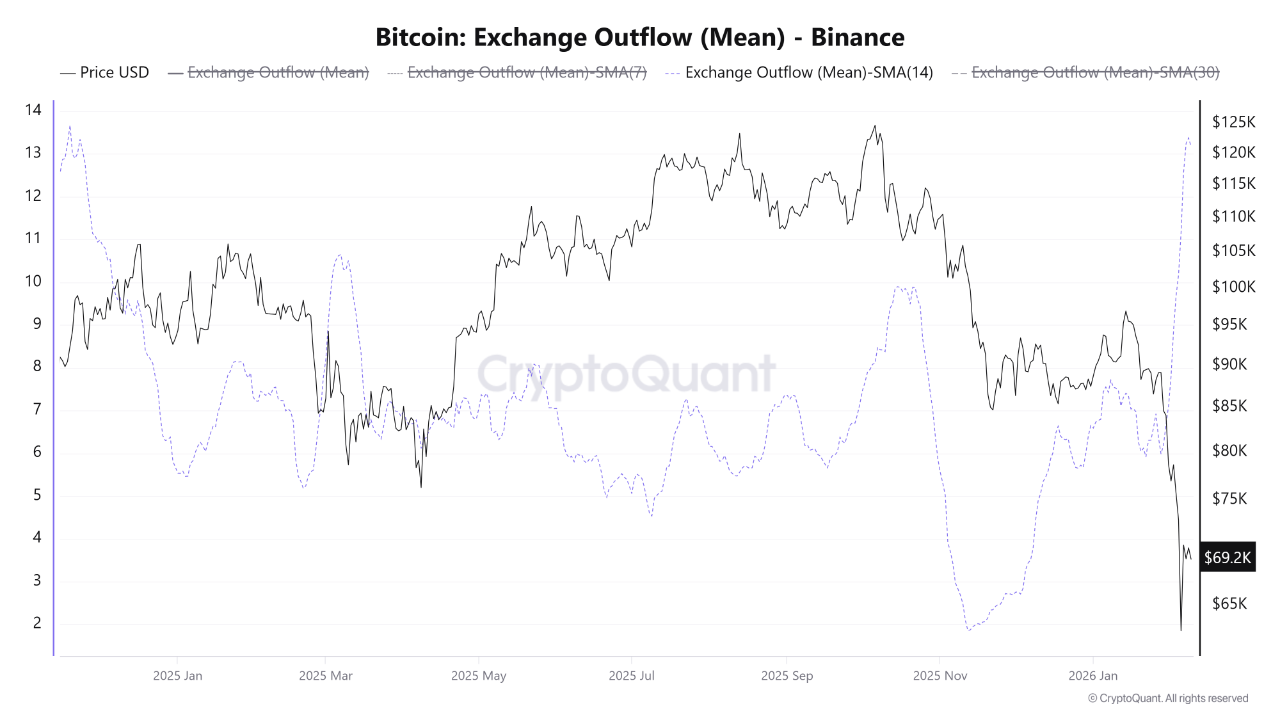
However, this accumulation has not yet translated into price stability or reversal. The gap between falling prices and rising withdrawal sizes creates a divergence worth monitoring. Smart money appears to be positioning for longer-term gains while accepting near-term downside risk.
Moving coins off exchanges to cold storage traditionally reduces immediate selling pressure. Yet the current market structure suggests this effect remains insufficient to halt the decline.
Bulls need price to reclaim $82,000 first, then push back into the low-to-mid $90,000s to establish a credible bottoming range. Without holding the $69,000 to $72,000 support zone, those recovery targets become increasingly distant possibilities.


 English (US) ·