
 3 weeks ago
33
3 weeks ago
33
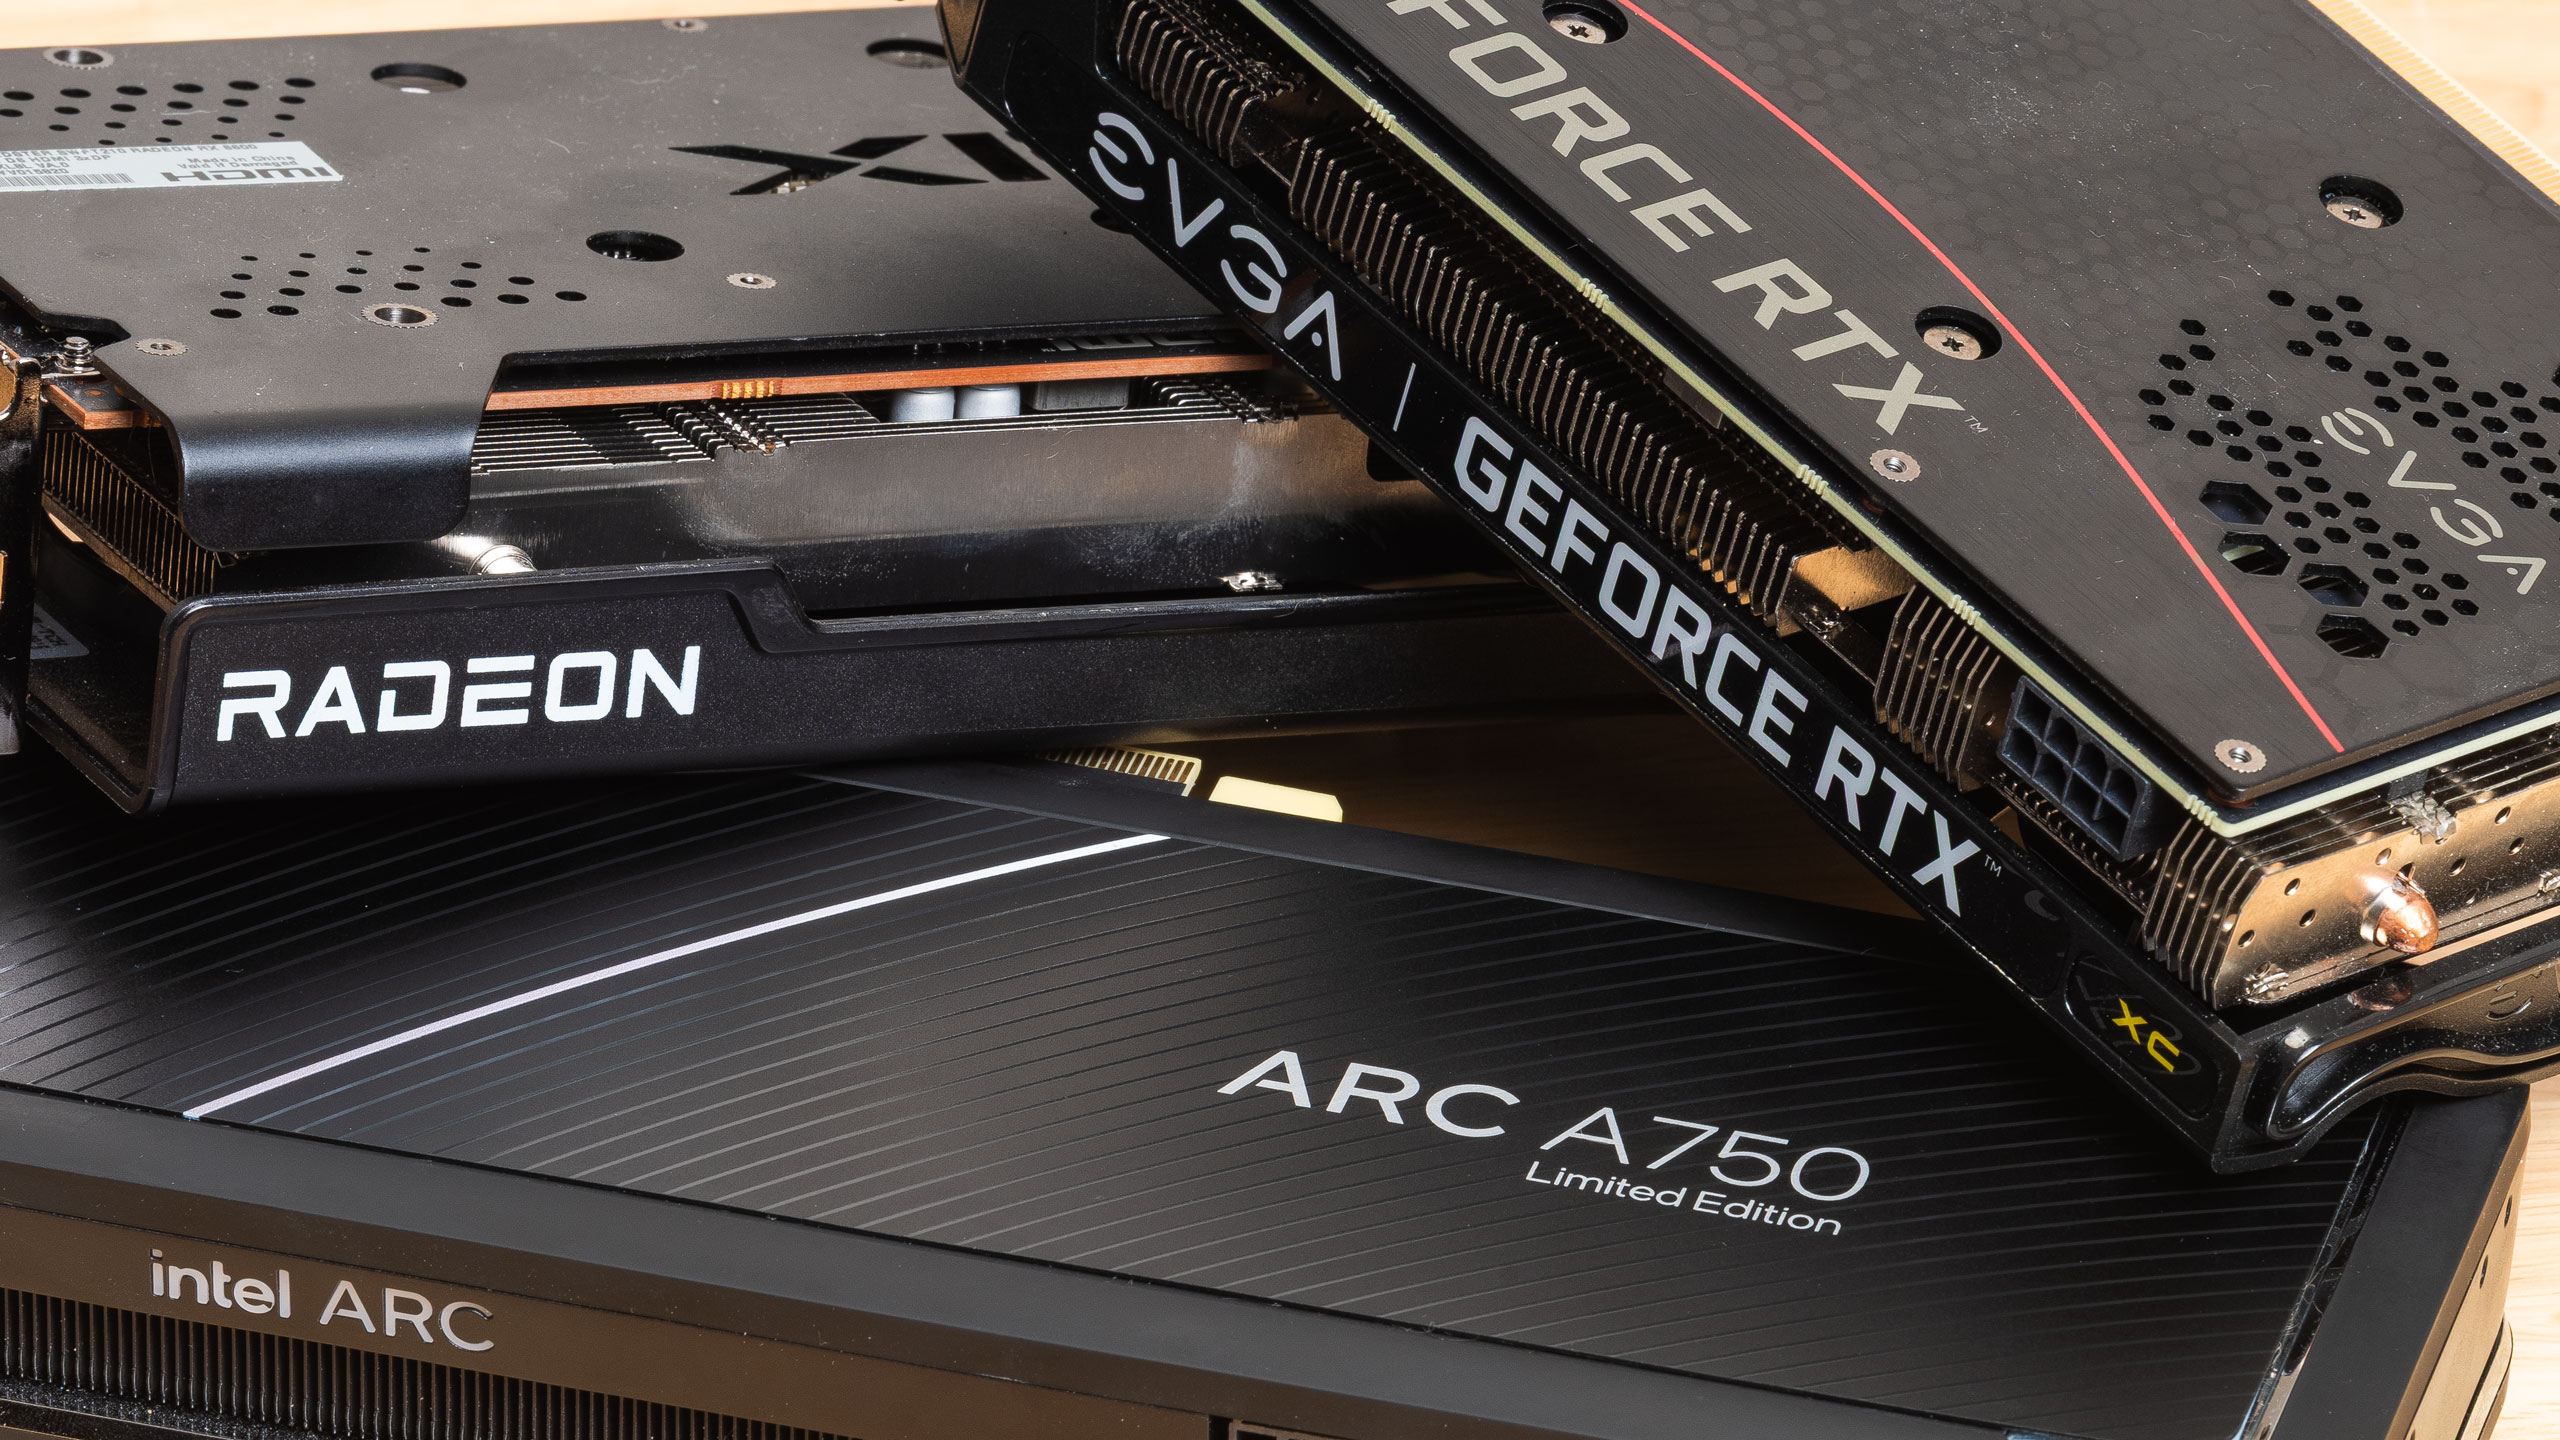
TechSpot has put together a comprehensive list of current-gen GPU prices from all the players, putting them head-to-head against what they used to cost in November 2025. The resulting data shows that graphics cards have become considerably more expensive over the past four months, especially toward the high end. Let's go over the most interesting examples that highlight these dynamics.
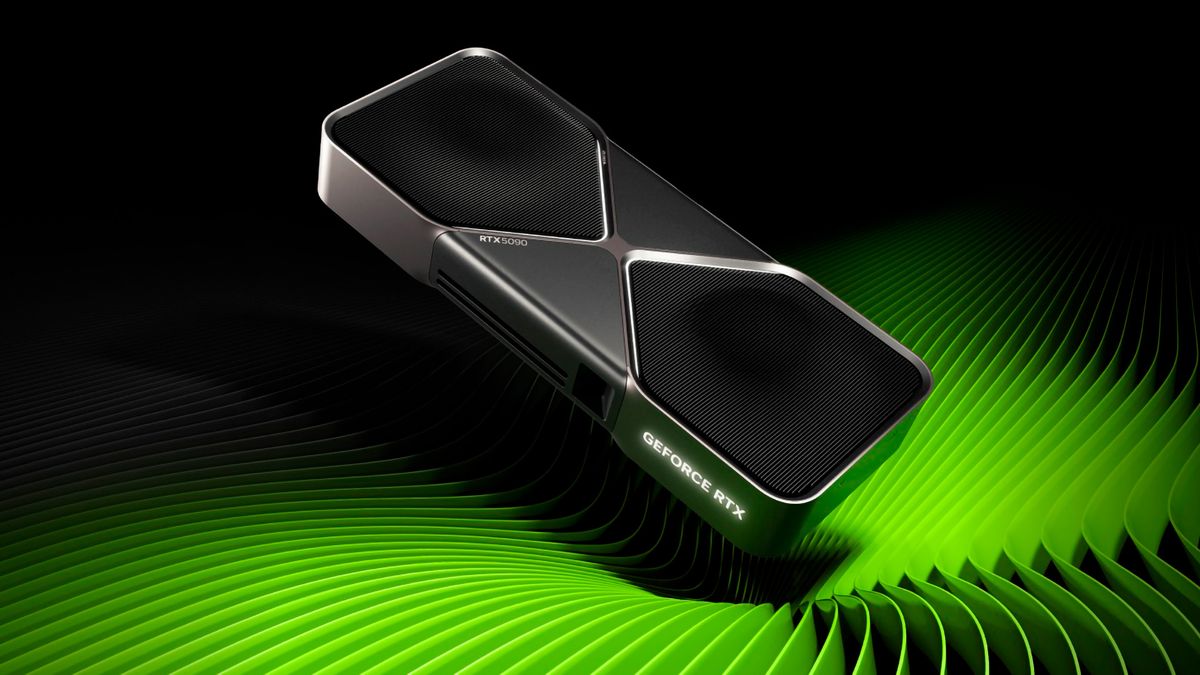
Right off the bat, the worst offender is the RTX 5090 — shocker, we know — as it has seen a massive $40 increase in price since November 2025. It cost $2,500 back then, and now it retails for over $3,500 in the U.S., but the steepest hike for it was actually in India. There, it used to sell for 261,000 INR (~$2,880) but has since gone up 54% to now cost 403,000 INR (~$4,447).
Across the world, on average, the RTX 5090 has surged 32% in these last few months and now sells for roughly 65% above its MSRP. TechSpot argues that this isn't even being positioned as a gaming GPU anymore, but rather as an AI workhorse whose 32 GB of GDDR7 VRAM is very useful to some professionals. Anyhow, you're likely to pay about $800 more to own one now than you would have last year.
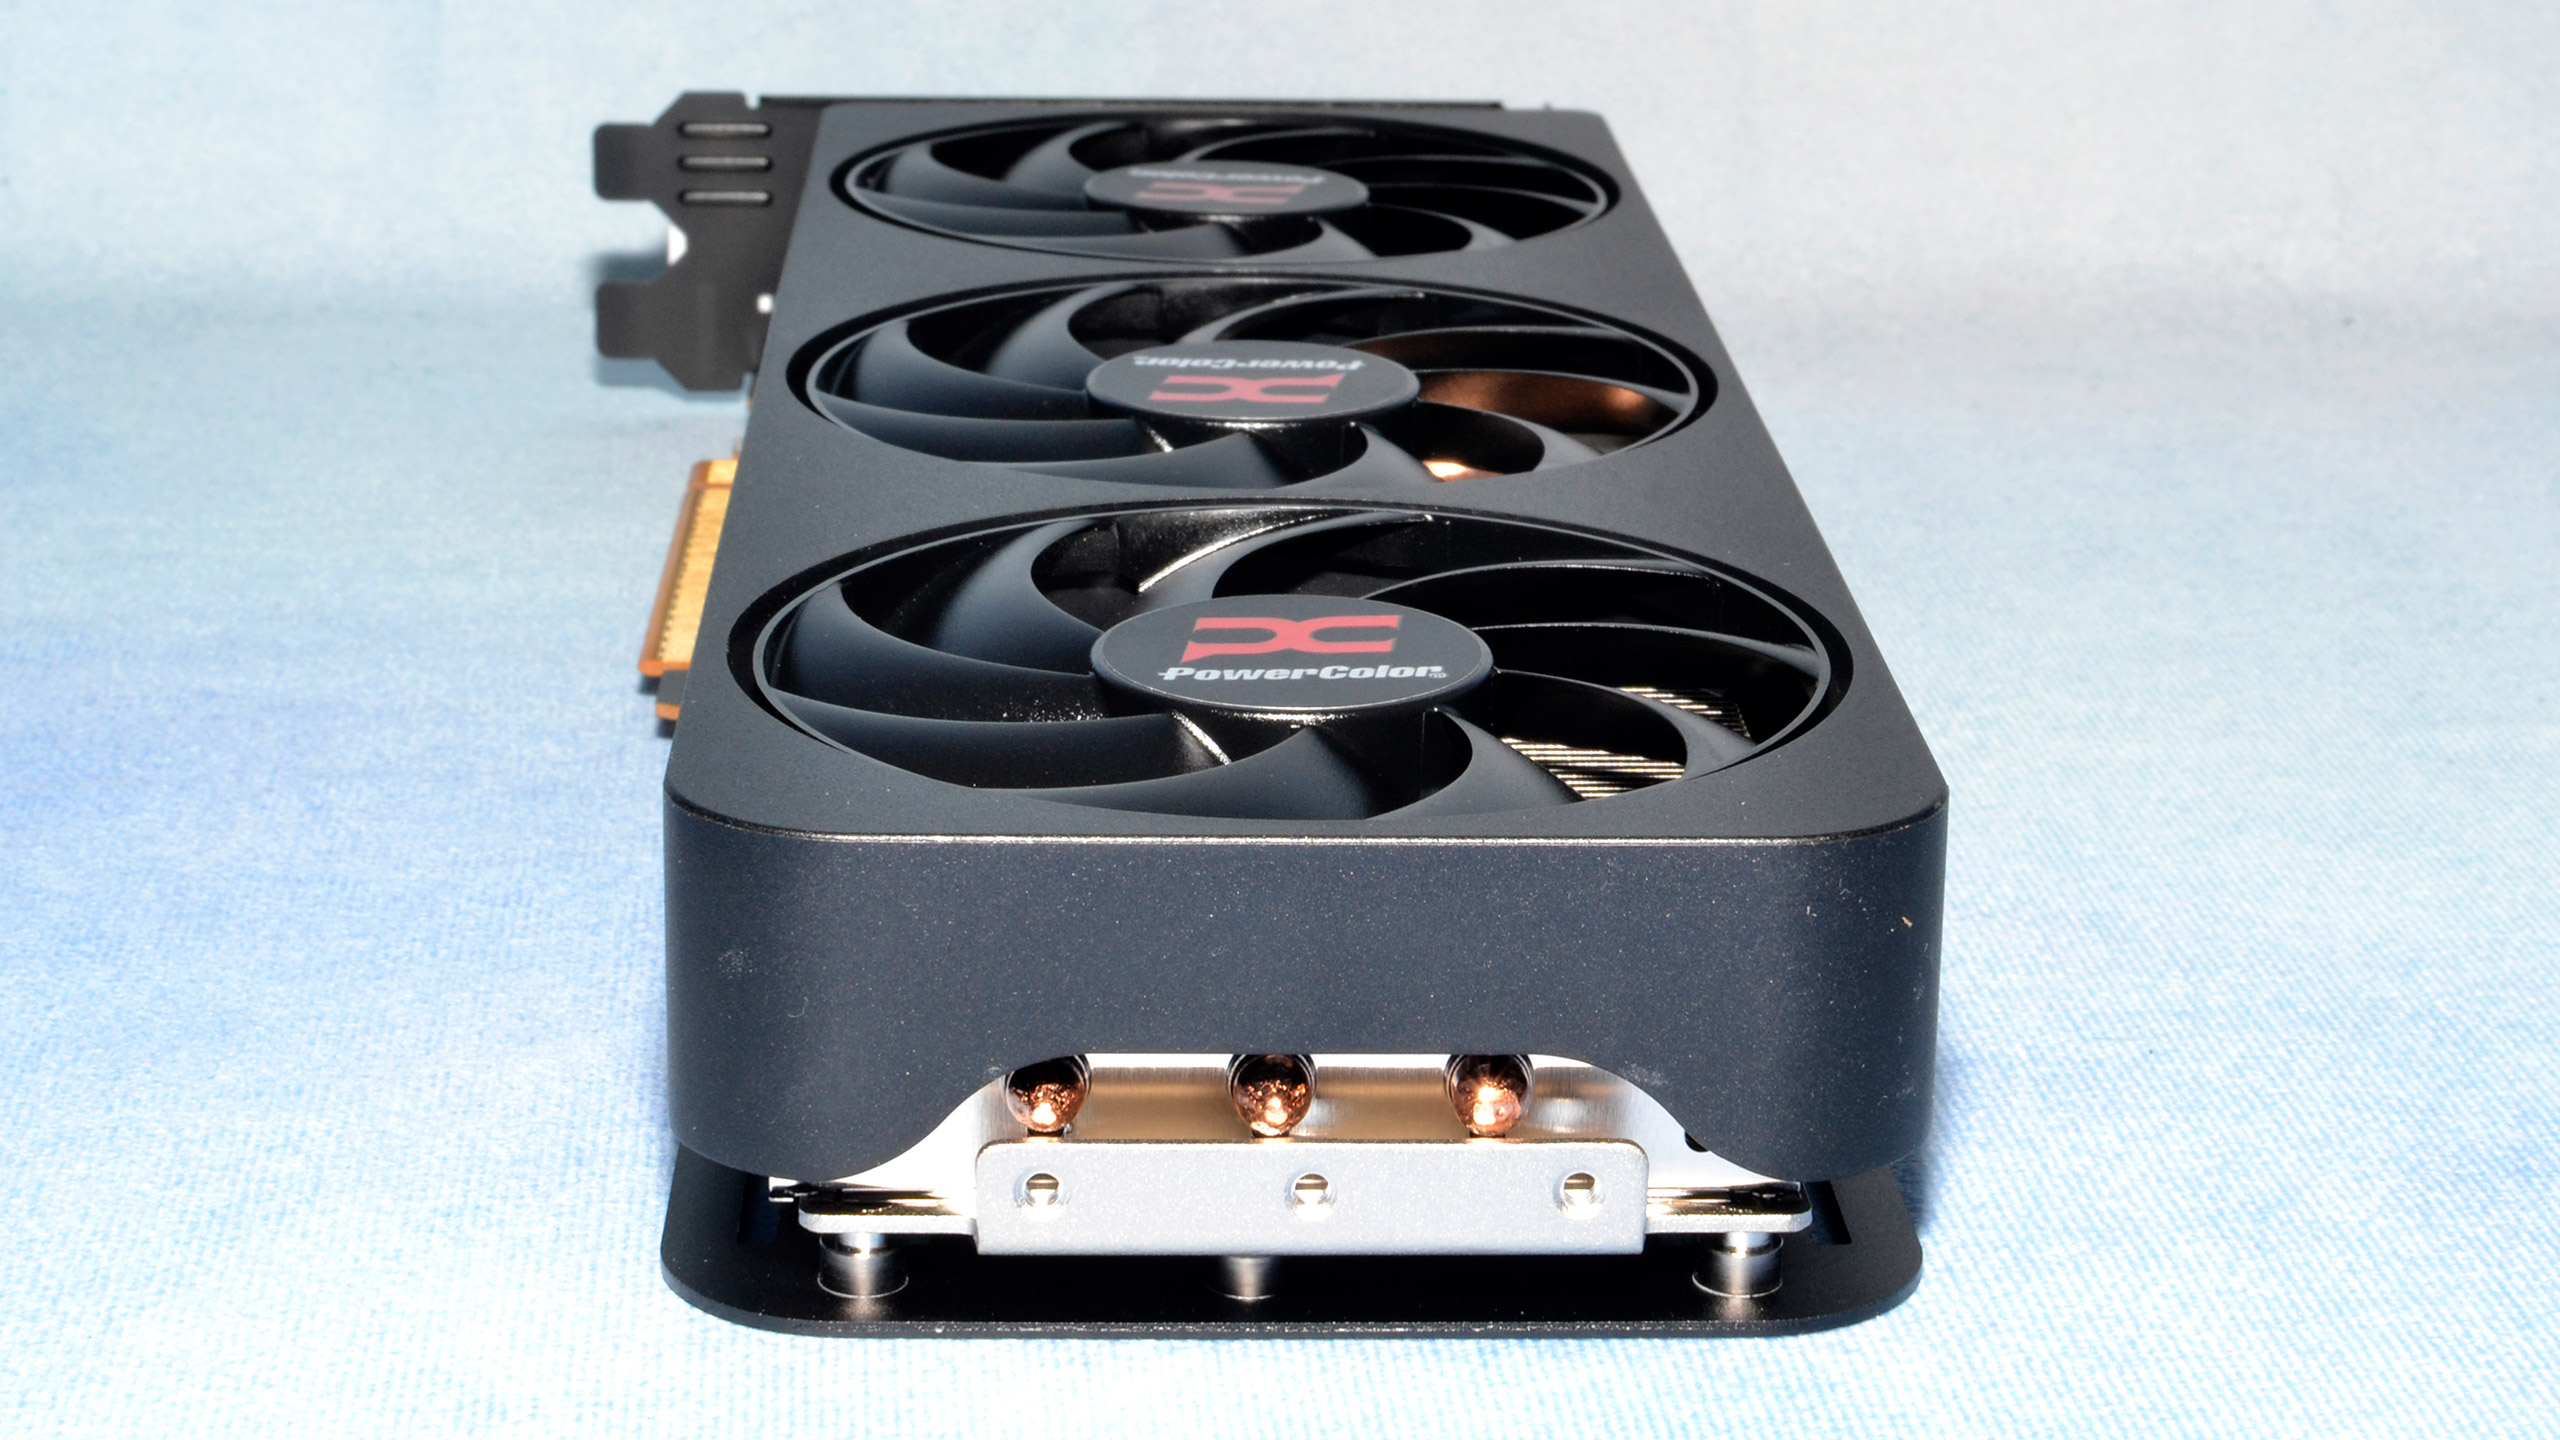
AMD's RX 9070 XT, our top pick for the best GPU you could buy today, coincidentally saw the least fluctuation, rising only 7% on average worldwide. America saw a much more significant 21% price jump, but it moved very little in other regions. The card actually became 9% cheaper in Brazil, where it was 4,700 BRL (~$900) four months ago, but costs "only" 4,300 BRL (~$823) today.
Brazil was actually an outlier throughout the list since it had several models that saw price reductions, such as the RTX 5050 and Intel's Arc B580. But since electronic items are already overpriced in that region, these improvements don't really mean much. Contrarily, India saw the most extreme inflation, particularly with 16 GB cards that we'll discuss in a bit.
Within the States, both the RTX 5060 and RTX 5060 Ti 8 GB saw only 3% price hikes, making them the least bloated models, with the RTX 5050 following closely at just 4%. Since these GPUs cost relatively less, even these increments only translate to $10 differences across all models — $290 to $300 on the 5060, $340 to $350 for the 5060 Ti, and $250 to $260 for the 5050.
One of the grimmest realizations from this data came at the $1,000 price point. Where you could once easily find an RTX 5080 in this range, now you can only snag an RTX 5070 Ti, as both of these have received significant price surges. RTX 5070 Ti is now 37% more expensive in the USA, while the RTX 5080 is 43% more expensive. You could find a 5070 Ti for $730 in November 2025, but now they're all about $300 more.
There was not a single region where the overall change wasn't negative, meaning every single country has more expensive GPUs now. Australia is technically the most stable, with only a 7.7% increase, while both India and Germany are about 21% costlier. America trails at +20%, so the point is, there are no real winners here — on average, GPUs are now 15% more expensive around the world.
Swipe to scroll horizontally
RTX 5050 | +4.0% | +7.0% | +14.0% | +5.0% | +12.0% | +21.0% | +6.0% | -5.0% | +15.0% | +8.0% | +8.7% |
RTX 5060 | +3.0% | +8.0% | +11.0% | +16.0% | +13.0% | +36.0% | +12.0% | +12.0% | +10.0% | +8.0% | +12.9% |
RTX 5060 Ti 8GB | +3.0% | +3.0% | +18.0% | +9.0% | +27.0% | +3.0% | +6.0% | +17.0% | +13.0% | +11.0% | +11.0% |
RTX 5060 Ti 16GB | +25.0% | +5.0% | +29.0% | +18.0% | +17.0% | +46.0% | +2.0% | +17.0% | +20.0% | +36.0% | +21.5% |
RTX 5070 | +15.0% | +7.0% | +21.0% | +9.0% | +17.0% | +23.0% | +7.0% | +8.0% | +13.0% | +16.0% | +13.6% |
RTX 5070 Ti | +37.0% | +17.0% | +33.0% | +16.0% | +22.0% | +39.0% | +20.0% | +16.0% | +22.0% | +28.0% | +25.0% |
RTX 5080 | +43.0% | +12.0% | +25.0% | +14.0% | +36.0% | +32.0% | +13.0% | +32.0% | +18.0% | +21.0% | +24.6% |
RTX 5090 | +40.0% | +24.0% | +31.0% | +23.0% | +26.0% | +54.0% | +19.0% | +30.0% | +50.0% | +19.0% | +31.6% |
RX 9070 | +6.0% | +8.0% | +13.0% | +12.0% | +1.0% | +2.0% | +5.0% | -6.0% | +10.0% | +19.0% | +7.0% |
RX 9070 XT | +21.0% | +4.0% | +13.0% | +7.0% | +13.0% | +1.0% | +5.0% | -9.0% | +7.0% | +13.0% | +7.5% |
Arc B570 | +25.0% | -8.0% | +19.0% | +18.0% | -6.0% | -2.0% | +0.0% | -12.0% | -4.0% | +4.0% | +3.4% |
Arc B580 | +20.0% | +5.0% | +25.0% | +35.0% | +9.0% | +5.0% | +8.0% | -18.0% | +9.0% | +9.0% | +10.7% |
Average by Region | +20.2% | +7.7% | +21.0% | +15.2% | +15.6% | +21.7% | +8.6% | +6.8% | +15.2% | +16.0% | +14.8% (overall) |
*Data compiled by TechSpot.

Follow Tom's Hardware on Google News, or add us as a preferred source, to get our latest news, analysis, & reviews in your feeds.


 English (US) ·