
 4 weeks ago
28
4 weeks ago
28
TLDR
- XRP trades near $1.41, with 24-hour volume of $1.64 billion and a market cap of $88.47 billion.
- Analyst EGRAG CRYPTO’s Elliott Wave analysis maps targets from $6.19 up to $27 over time.
- XRP holds above its 20, 50, 100, and 200-day EMAs, shifting the trend to bullish.
- US spot XRP ETFs added $18.96 million in inflows this week, taking cumulative inflows to $1.68 billion.
- The Fed’s September 16 rate decision and Friday’s CPI report are the next major catalysts.
XRP is trading at $1.41 as of September 7, 2026. The token has a 24-hour trading volume of $1.64 billion and a market capitalization of $88.47 billion.
The price has stayed close to this level over the past day. Buyers continue to test resistance between $1.43 and $1.50.
XRP rallied from around $0.99 on August 11 to $1.70 on August 22. It has since pulled back and traded mostly between $1.30 and $1.50.
Crypto analyst EGRAG CRYPTO shared a long-term Elliott Wave analysis pointing to a possible Wave 5 advance for XRP. The analysis lays out several upside targets tied to this structure.
#XRP – 3M Macro Wave 5 Target Zone  :
:
The targets start lining up clearly:  $6.19–$8.07 = first major Wave 5 zone $11.45 = stronger Wave 5 extension $13+ = cycle expansion zone $17+ = upper macro target if momentum accelerates.MACRO Expansion Cycle $27+…..… pic.twitter.com/jSJC2BDfcK
— EGRAG CRYPTO (@egragcrypto) September 6, 2026
The first target zone sits between $6.19 and $8.07. A break above that range, EGRAG CRYPTO notes, could open the door to further gains.
The chart places $11.45 as a stronger Wave 5 extension, with $13 as a further stage. In a strong cycle, the analysis lists $17 and eventually $27 as top scenarios.
These levels are technical projections, not guarantees. They depend on sustained demand, trading volume, and broader market conditions holding up.
XRP Technical Structure Improves
XRP fell during June and July, bottoming near $1.00 in early August. Bollinger Bands tightened during that stretch as volatility dropped.
The token then broke above $1.70 in late August before retracing. It now holds support around $1.41.
XRP is trading above its 20, 50, 100, and 200-day EMAs. This lineup has shifted the short-term trend from bearish to bullish.
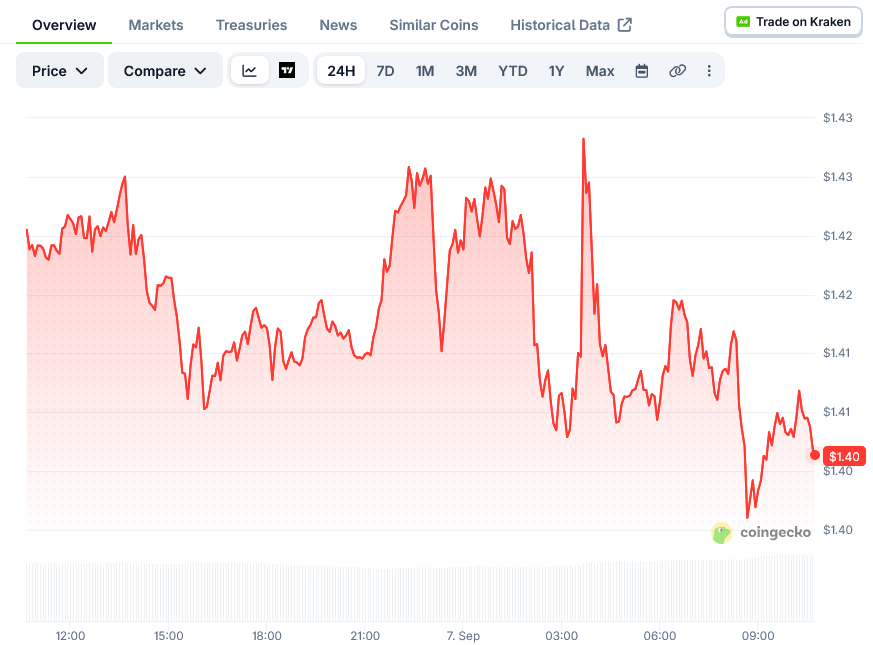 XRP Price on CoinGecko
The 200-day EMA sits near $1.35 and has started to flatten. Traders are watching whether XRP holds this level during the current pullback.
If $1.35 fails, the next support sits near $1.25, where the 50-day EMA is located. A break below the 200-day EMA would weaken the recovery setup.
ETF Inflows and Fed Decision in Focus
Data from BankXRP shows US spot XRP ETFs added $18.96 million in net inflows this past week. Cumulative inflows have reached $1.68 billion since launch.
Combined net assets across these funds stand at $1.48 billion. One fund alone holds more than 362 million XRP, worth roughly $507.5 million.
Coinglass data shows XRP derivatives volume rose 14.81% to $2.84 billion. Open interest fell 1.49% to $3.11 billion over the same period.
The Fed’s next policy meeting is set for September 16. Last month’s US jobs report added 162,000 positions, well above the 53,000 forecast, pushing the 10-year Treasury yield to about 4.82%.
CME FedWatch data currently puts the odds of a rate hike at 58.4%. The Consumer Price Index report is due Friday, September 11, ahead of the Fed meeting.
The post XRP (XRP) Price: What $1.43 Resistance Means for the Next Move appeared first on Blockonomi.








 English (US) ·