
 3 weeks ago
16
3 weeks ago
16
TLDR:
- XRP climbed to $1.54 and gained about 10% over the week, while the four-hour chart shows $1.50 support and $1.60 resistance.
- SEC staff discussed buybacks, staking receipts, network maintenance, and promotion, but the nonbinding guidance does not classify XRP.
- Five U.S. spot XRP ETFs recorded $22.65 million in September 25 inflows, with Bitwise contributing $18.39 million, or about 81%.
- XRP’s monthly RSI remains below its moving average; historical rally comparisons are not price targets, and the crossover remains unconfirmed.
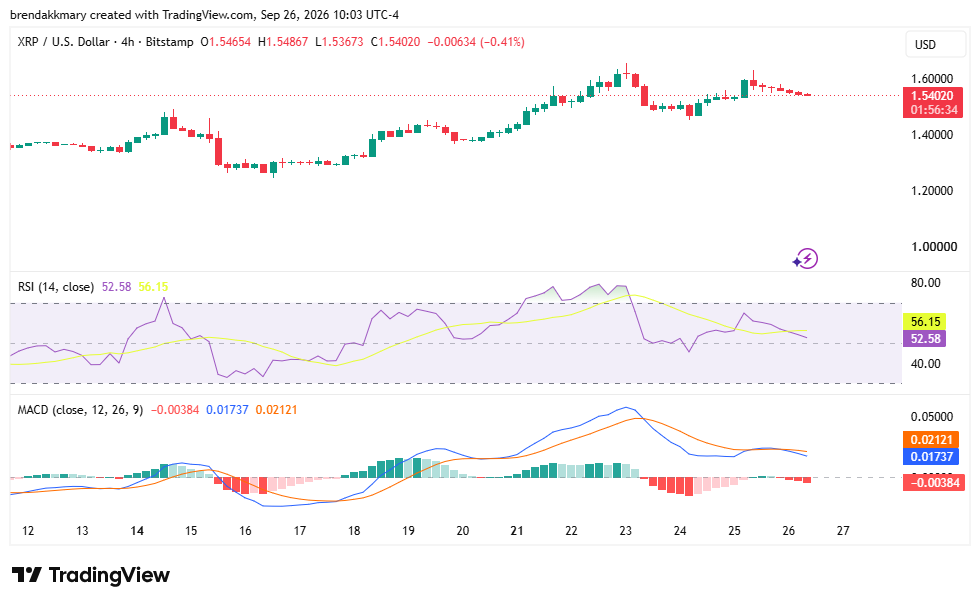
XRP price prediction has two near-term reference points: $1.50 support and $1.60 resistance. XRP rose to $1.54 during a broader market rebound and stood about 10% higher over the week. On the four-hour chart, the token eased to $1.5535 by 08:41 UTC Saturday after reaching $1.60 earlier in the week.
SEC staff published fresh crypto guidance September 25, after the Senate failed to advance the CLARITY Act earlier this month. That guidance discusses token buybacks, staking receipts, network maintenance, and promotional claims, but it does not classify XRP. Spot XRP ETFs also recorded $22.65 million in inflows on September 25.
XRP Price Prediction Tracks Support After SEC Guidance
The CLARITY Act’s failure leaves proposed federal market rules unresolved. SEC staff addressed questions about digital assets under securities analysis. Staff said buybacks involving nonsecurity tokens on functional networks do not necessarily imply promised managerial work. Certain staking receipts may qualify as digital tools or commodities, depending on structure and issuance.
BREAKING:  The SEC starts bringing crypto clarity after the CLARITY Act failed to pass.
Details include:
• Token buybacks on working protocols aren’t seen as management
• Liquid staking tokens are digital commodities, not securities
• Maintenance, upgrades & grants… pic.twitter.com/PvERbcdWea
— Crypto Rover (@cryptorover) September 26, 2026
Staff said routine upgrades and promotion of existing uses may fall outside investment-contract analysis. The staff answers carry no legal force and leave XRP’s status unresolved. For XRP price prediction, the guidance adds context but offers no XRP-specific ruling.
Five U.S. spot XRP ETFs drew $22.65 million in net inflows on September 25. Bitwise brought in $18.39 million, about 81% of the total. Franklin Templeton’s XRPZ received $4.26 million; three other products recorded no net movement. Cumulative net inflows reached $1.79 billion, and combined net assets stood at $1.77 billion.
Combined assets equaled 1.80% of XRP’s market capitalization. The funds traded $57.75 million, including $37.07 million from Bitwise. The figures show inflows concentrated in two products but do not prove ETF purchases caused the weekly advance. ETF trading value is separate from net inflows. ETF demand adds context to XRP price prediction, while Kalshi’s September forecast stood at $1.70. Odds can shift.
XRP Price Prediction Waits for Monthly RSI Confirmation
On the four-hour chart, $1.60 marks immediate resistance after recent advances stalled there. A sustained move above it could put $1.65 and then $1.70 in focus. The $1.50 area steadied the pullback after September 23. A close below support could expose $1.45 and weaken the short-term recovery. The XRP price prediction setup therefore hinges on these nearby levels.
The four-hour RSI was 52, just above its midpoint of 50. The MACD line sat below its signal line, pointing to weaker short-term momentum. Buyers need to defend $1.50, while a move through $1.60 would test whether demand can extend the rebound. A brief break would not confirm a sustained breakout.
The monthly chart presents a longer-term comparison. XRP’s RSI has returned to a lower range seen before two earlier advances, but it remains below its yellow moving-average line. For XRP price prediction, the monthly confirmation condition is an RSI crossover above that average. The current line has begun turning upward, though it has not crossed. The monthly signal does not confirm four-hour momentum.
 Source: TradingView
One example shows XRP near $0.18 before it later reached almost $2. In another, it traded around $0.37 before advancing toward $3.30. Those changes equal roughly 11.11 times and 8.92 times their starting levels. Applying those multiples mechanically to $1.54 gives about $17.11 and $13.74, respectively. The comparisons describe past moves, not targets for this cycle. These simple calculations use rounded historical prices.
XRP remains within long-term moving-average bands after its 2025 retreat. Similar RSI zones appeared around 2017 and 2021, but those setups began from different prices and market conditions. On the current monthly chart, XRP’s RSI remains below its moving average, leaving the highlighted crossover still unconfirmed.
The post XRP Price Faces $1.60 Test as SEC Guidance Follows CLARITY Act Failure appeared first on Blockonomi.








 English (US) ·