
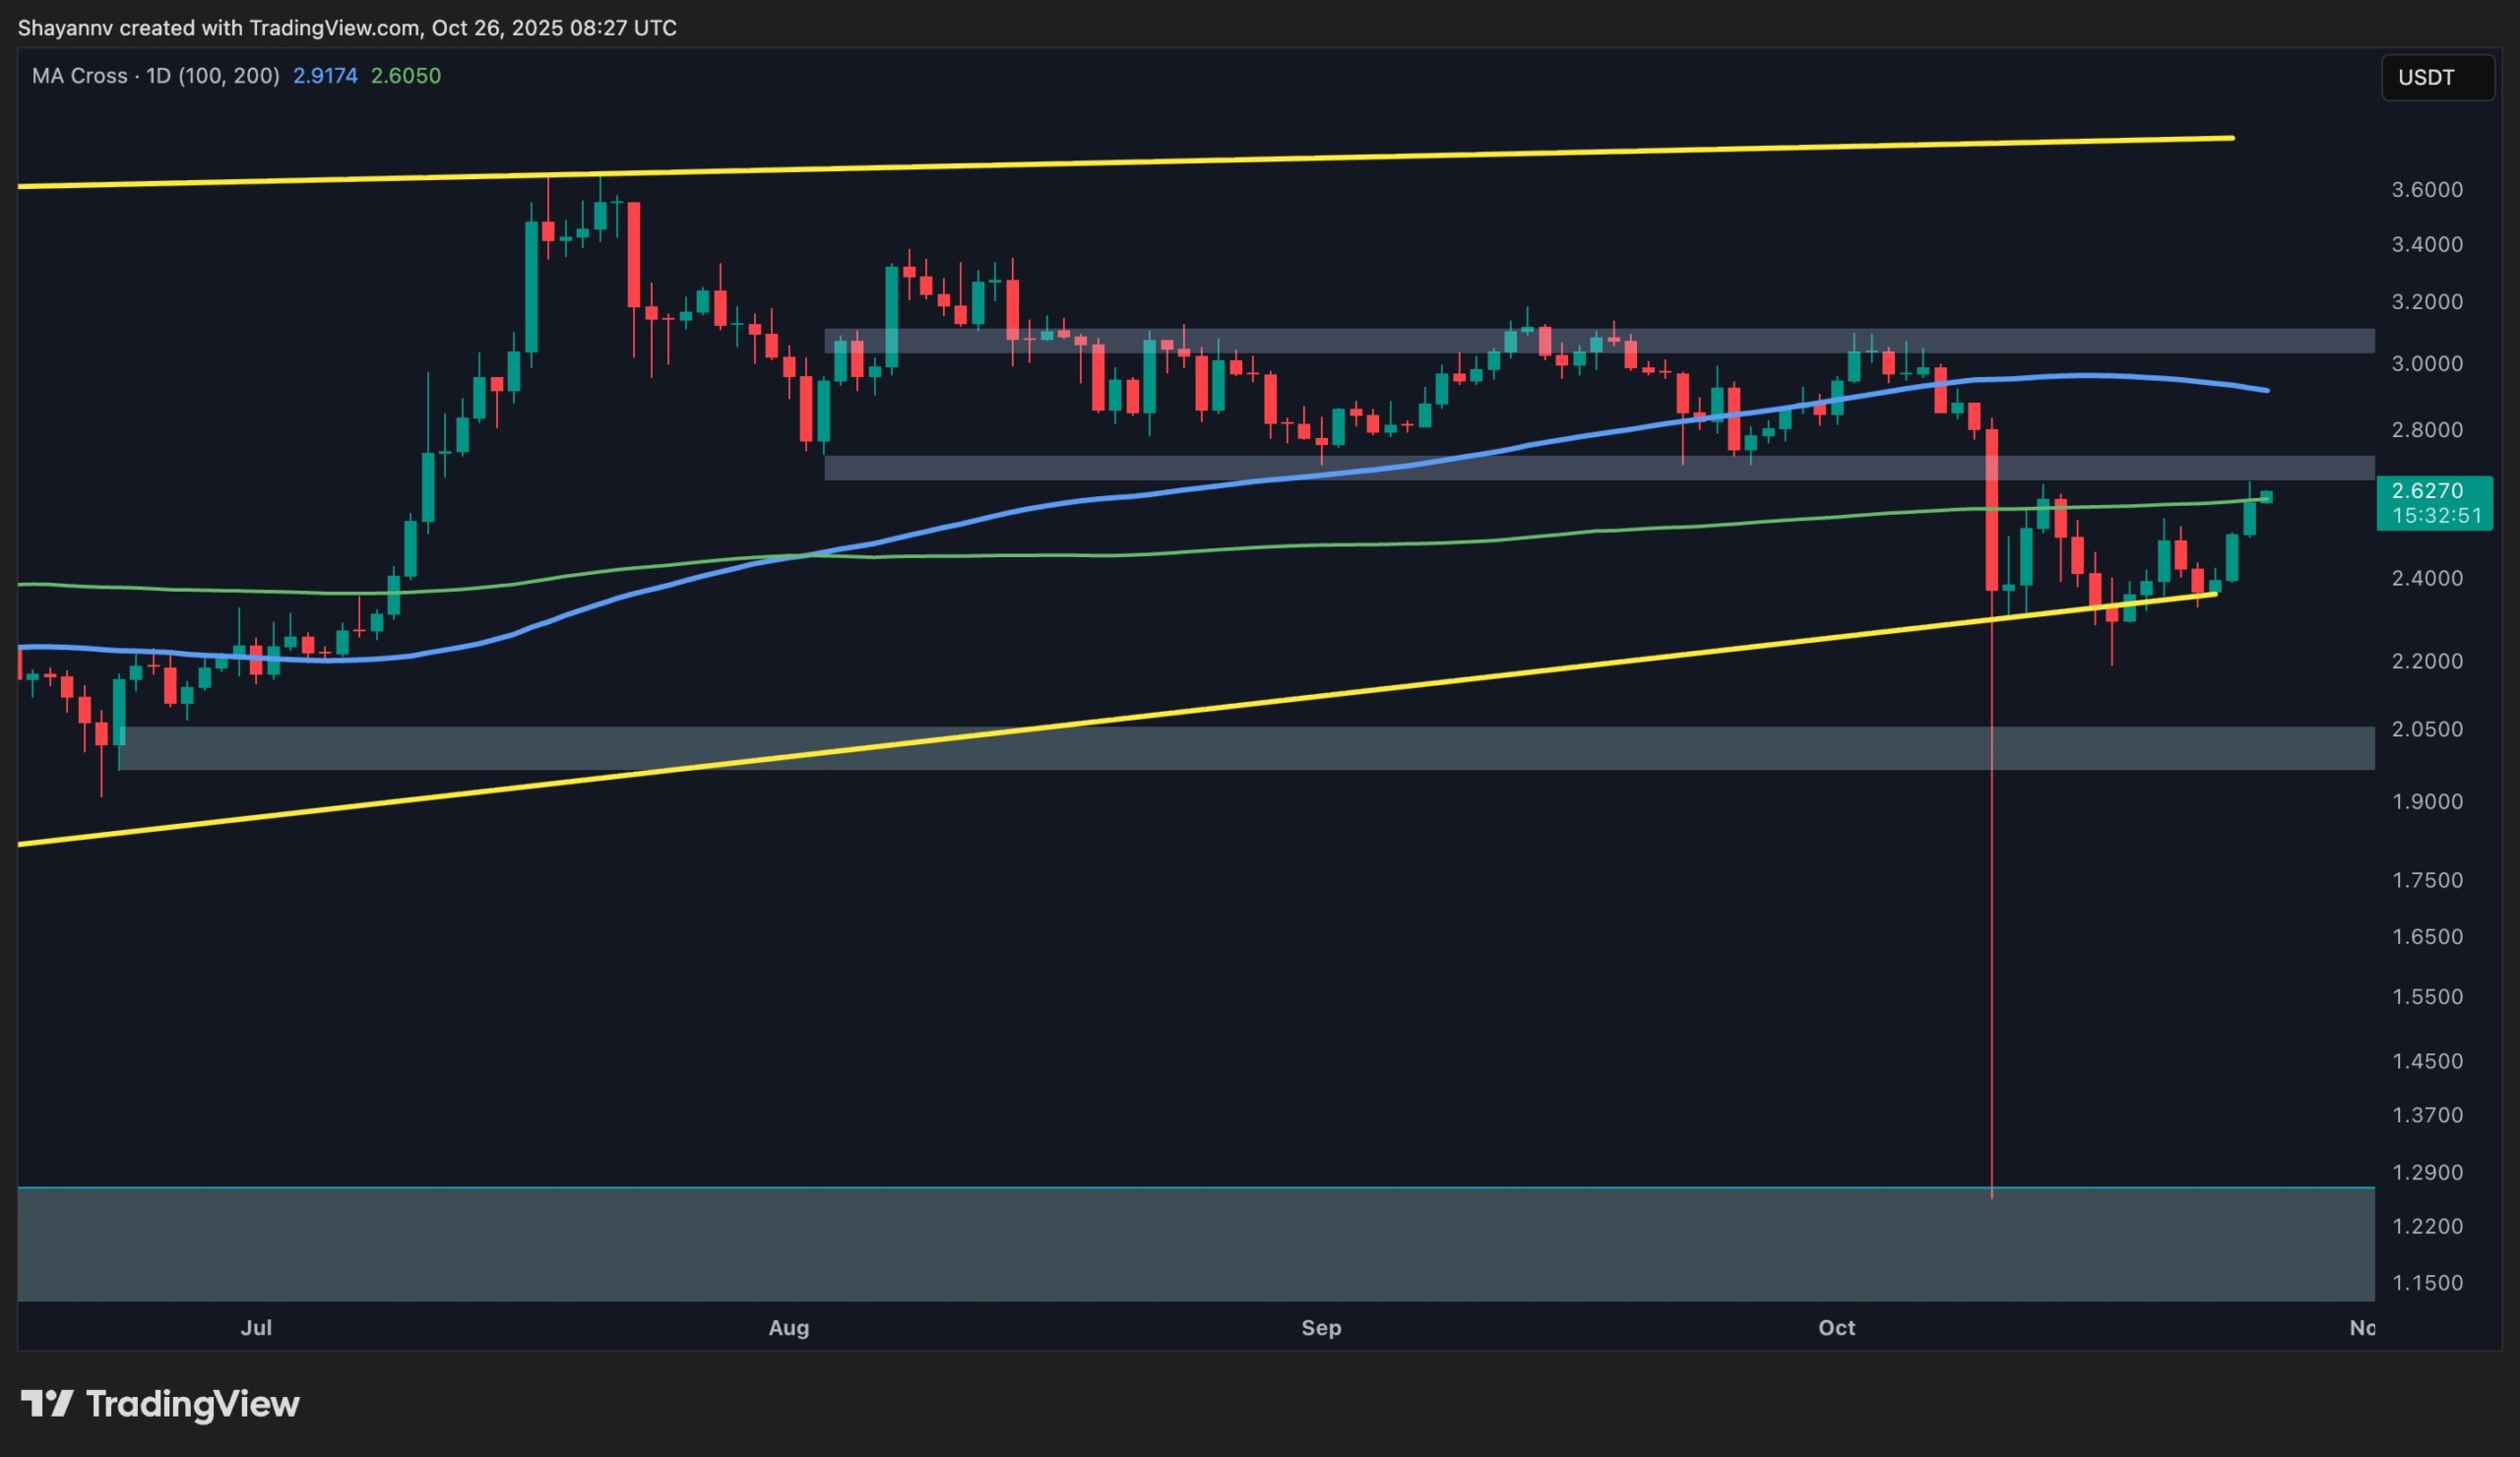
Ripple’s XRP has managed to slightly break above the 200-day moving average (MA) at $2.6, marking an early bullish signal. However, with significant supply zones directly ahead, the probability of an extended consolidation phase remains high until a decisive move confirms trend continuation.
Ripple Price Analysis
By Shayan
The Daily Chart
On the daily timeframe, XRP has attracted notable buying interest from the lower boundary of its multi-month ascending wedge, initiating a recovery phase. The asset has now reached and slightly surpassed the 200-day MA at $2.6, a key technical milestone that suggests a potential shift in sentiment — provided it can hold above this level.
However, the $2.7 supply zone sits just above the moving average, representing a critical obstacle that could reject further upward momentum and maintain price compression within the broader wedge. Therefore, XRP’s behavior around this confluence zone will be pivotal in defining the next directional trend.
The 4-Hour Chart
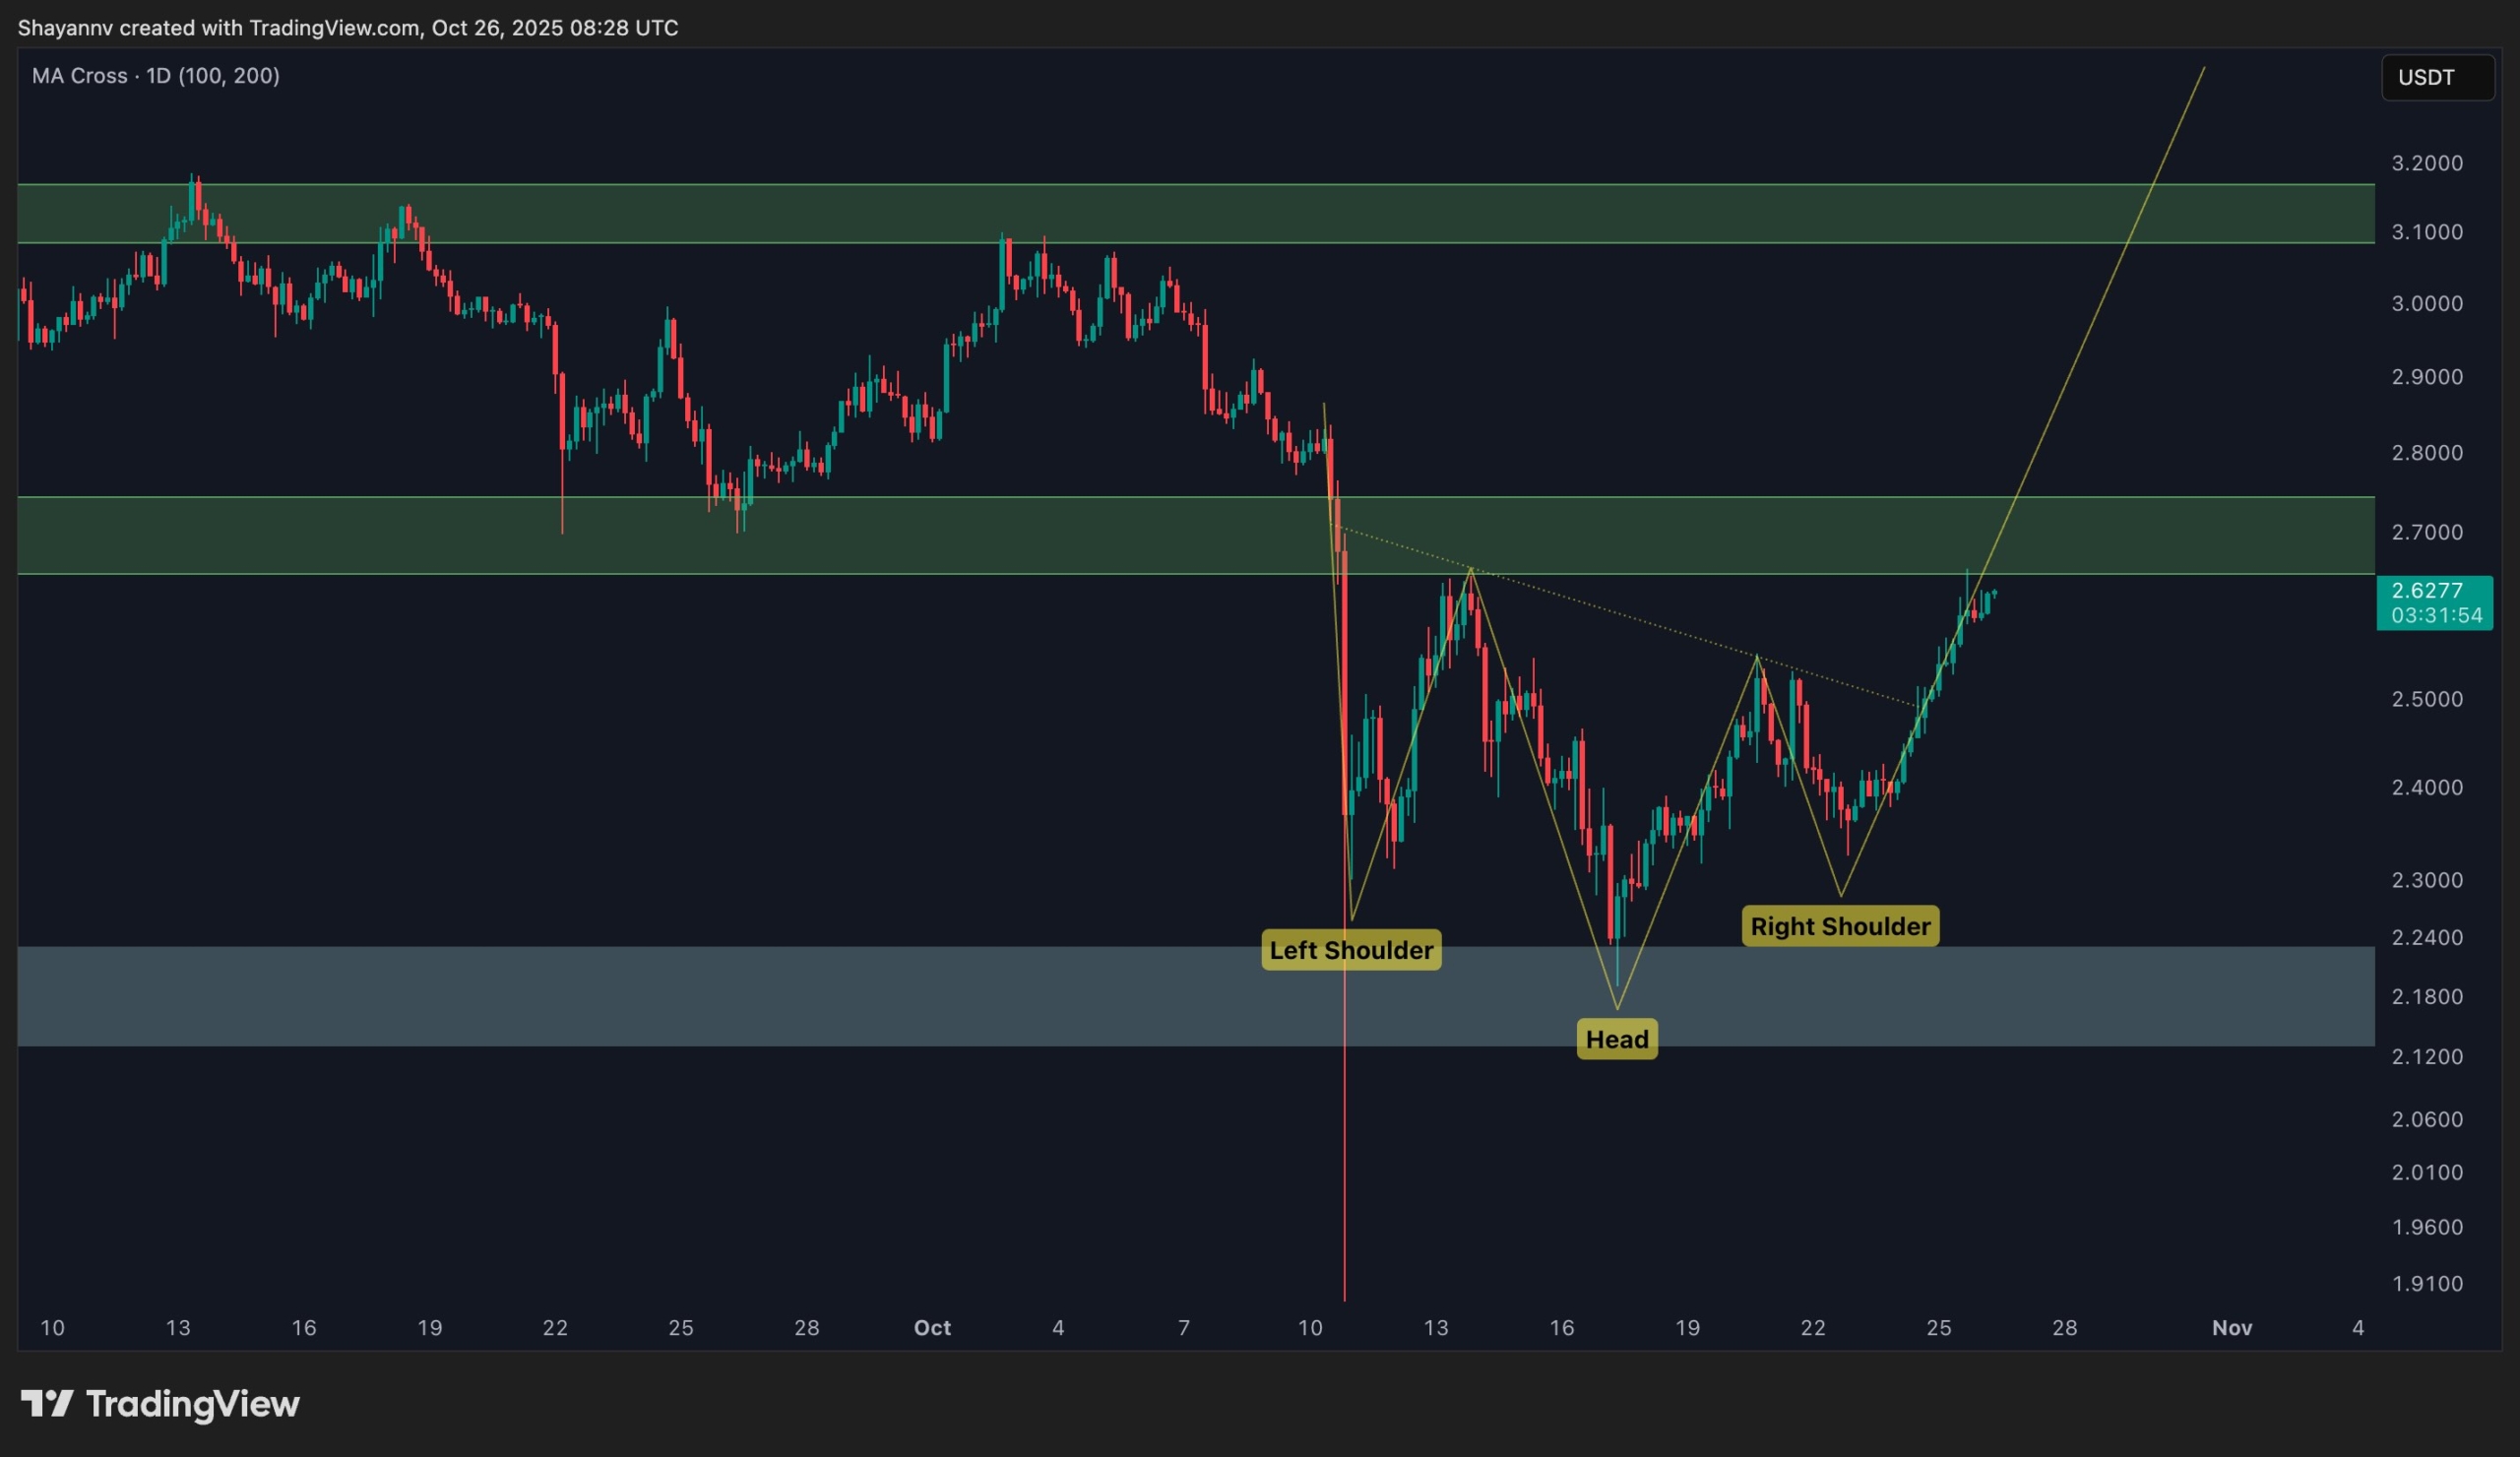
The 4-hour structure shows a clear accumulation pattern forming around the $2.2 support region, which has triggered a strong bullish reversal. The asset’s recent breakout from an inverted head-and-shoulders pattern underscores improving market sentiment, driving the price toward the $2.6 resistance level.
If XRP manages to retest the broken neckline and establish a stable pullback structure, continued bullish momentum could emerge, with potential targets extending toward $2.8 and beyond. Conversely, failure to maintain momentum above $2.6 may lead to sideways consolidation, keeping the asset range-bound in the short term.
Binance Free $600 (CryptoPotato Exclusive): Use this link to register a new account and receive $600 exclusive welcome offer on Binance (full details).
LIMITED OFFER for CryptoPotato readers at Bybit: Use this link to register and open a $500 FREE position on any coin!
Disclaimer: Information found on CryptoPotato is those of writers quoted. It does not represent the opinions of CryptoPotato on whether to buy, sell, or hold any investments. You are advised to conduct your own research before making any investment decisions. Use provided information at your own risk. See Disclaimer for more information.
Cryptocurrency charts by TradingView.
![]()
About the author
Full-time on-chain Data Analyst and Python Programmer. Passionate about Bitcoin and DataVisualization.


 English (US) ·