
 4 weeks ago
87
4 weeks ago
87
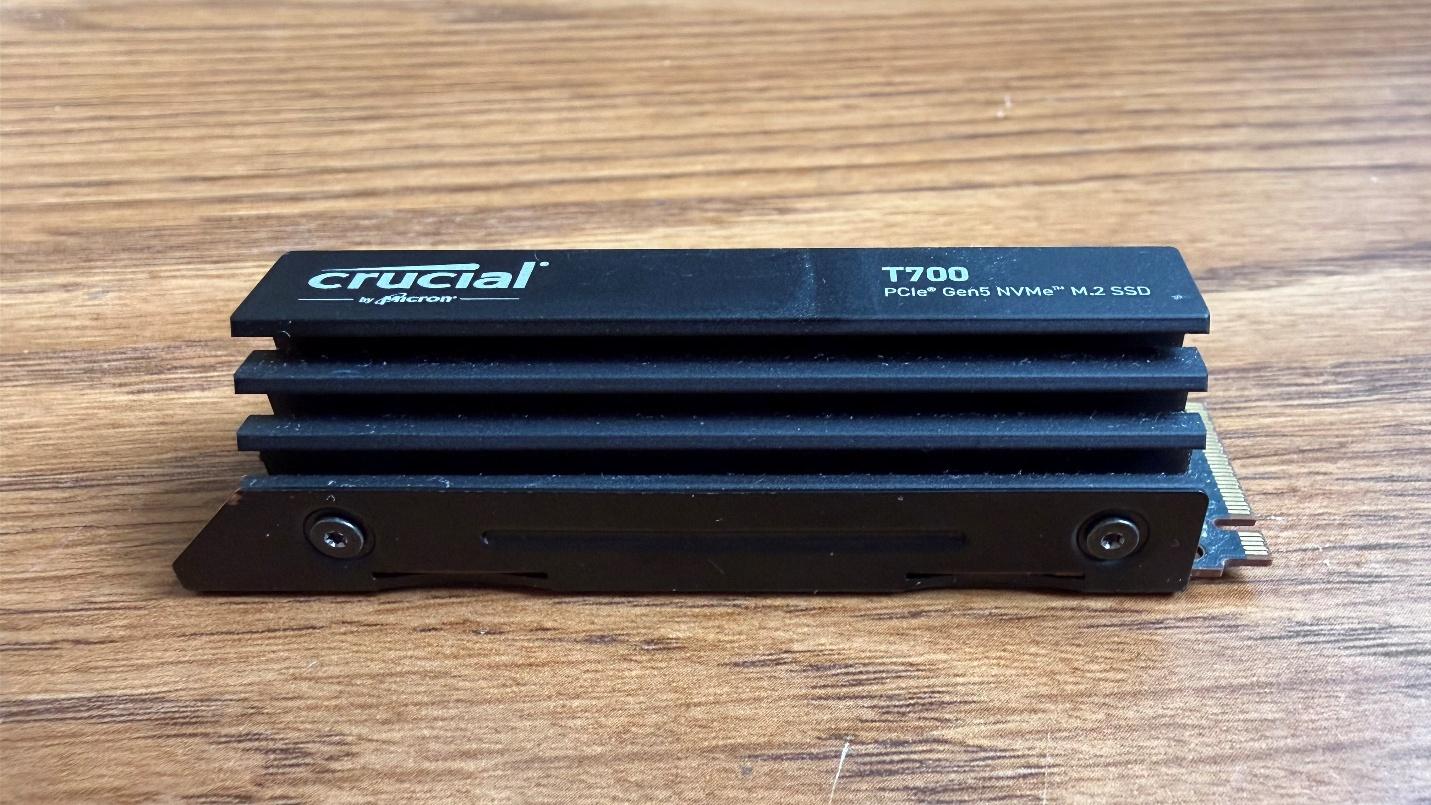
We tested gaming performance with both NVMe and SATA SSDs across 11 games to determine if upgrading to a faster drive is worth it. Solid-state drives (SSDs) have been a staple of PC gaming for years, but their importance grew significantly with the launch of the PlayStation 5 and Xbox Series X|S in 2020. Both consoles feature high-speed NVMe SSDs and storage architectures designed to fully leverage their capabilities, enabling faster asset streaming and reducing traditional storage bottlenecks.
As a result, game developers have increasingly developed their titles for SSDs, with many modern games now listing them as a minimum system requirement. But how exactly do games use SSDs during gameplay, and does upgrading to a faster SSD actually improve gaming performance? In this article, we'll examine SSD activity in modern games and determine whether higher storage speeds translate into a better gaming experience. Given the surge in SSD prices, will a slower drive deliver comparable gaming performance to high-end alternatives?
Load Times
Load Times
While this article focuses primarily on SSD activity and performance during gameplay, loading times remain one of the most significant advantages of solid-state storage. It's well known that games can take several minutes to load from an HDD, whereas modern SSDs typically reduce load times to just a few seconds.
The gap between SSDs is much smaller. In some titles, PCIe NVMe drives can load games several times faster than SATA SSDs, but in many cases, the difference is relatively small. Naturally, different generations of PCIe SSDs have even smaller differences, with flagship drives often delivering only marginal improvements to loading times despite their substantially higher sequential throughput.
Disk I/O Operations in Games
Disk I/O Operations in Games
Before examining the performance results, it's important to understand the types of disk I/O operations that games typically generate. Two key metrics are block size and queue depth. The block size of an I/O operation defines the size of the chunk of data a game will read at one time, while queue depth is the number of pending I/O requests that a storage device has queued at any one time.
During gameplay, the vast majority of storage activity consists of random read operations as game assets are streamed from storage into memory. Sequential reads are less common, and write activity is generally minimal.
Microsoft provides several storage optimization recommendations for developers in its DirectStorage documentation. Although these guidelines are intended for DirectStorage-enabled titles, many of the underlying principles apply to games in general, even if they do not use DirectStorage. Among Microsoft's recommendations are the use of block sizes of at least 32k and sufficiently high queue depths to maximize storage throughput.
Modern games typically employ 32k or 64k random I/O requests. However, despite Microsoft's recommendations, most games continue to operate at relatively low queue depths.
Performance Comparison
Performance Comparison
Now we will examine SSD activity and compare performance across different SSD generations. The games included in our testing were selected because they either exhibited higher storage bandwidth than usual, had greater peak or average SSD utilization, had support for DirectStorage, or because they are popular titles that many gamers would be interested in seeing analyzed from a storage-performance perspective.
To place as much stress as possible on each SSD, all testing was conducted with 16GB of system memory. Using a smaller memory capacity reduces the amount of game data that can be held in RAM, forcing games to rely more heavily on the SSD than they would in a 64GB configuration. It also better reflects the configurations found in many mainstream gaming PCs. That said, we observed little difference in SSD activity when comparing 16GB and 64GB memory configurations.
When interpreting the SSD activity data below, it is important to understand that 100% utilization does not necessarily mean an SSD is reaching its maximum rated bandwidth. For example, a PCIe 4.0 SSD reporting 100% utilization is unlikely to be delivering its full 7.5 GB/s of sequential read throughput. In gaming workloads, SSDs can become fully utilized while transferring data at significantly lower bandwidths.
This is because the speeds advertised by SSD manufacturers are based on sequential read performance, whereas games primarily rely on random reads. While random-read throughput can approach sequential-read speeds under certain conditions, doing so requires sufficiently large block sizes and high queue depths. Although modern games often use relatively large block sizes, they typically do not use the high queue depths needed to fully saturate an SSD's theoretical bandwidth.
We have also chosen not to test any traditional hard drive disks. There are many documented examples of modern games performing poorly, taking an unbearably long time to load, or having visual issues when installing the game on an HDD. There are some games where this may not be an issue, but we still do not recommend playing modern games on an HDD.
The testing was conducted in gameplay. No built-in benchmarks were used. We found that SSD activity increases with higher settings, so that is where we focused our testing. We set each game to its absolute maximum settings.
We used HWiNFO to measure SSD activity and set it to the lowest polling rate possible to capture activity accurately without incurring overhead.
Test system
- MSI GeForce RTX 5090 Vanguard SOC
- Ryzen 7 9800X3D
- 16GB G.Skill Trident Z5 DDR5 6000 MHz CL30
- Crucial T700 Gen5 SSD
- Sabrent Rocket 4 Plus-G Gen4 SSD
- Adata XPG SX8200 Pro Gen3 SSD
- Samsung 870 EVO SATA III SSD
- Asus ROG Strix B850-F Gaming WiFi
- Corsair Nautilus 360 RS AIO Cooler
- MSI MPG Ai1600TS PCIe 5 PSU
- HAGS enabled
- Windows 11 25H2 (Build 26200.8737)
- Nvidia driver 610.62
Forspoken
Forspoken
Forspoken was the first game to support DirectStorage on PC. DirectStorage is a feature that aims to allow games to make full use of high-speed storage devices while reducing the CPU overhead associated with making reads from disk.
Looking at the table below, you can see that it does exhibit a fairly high peak and average bandwidth. In fact, it’s the highest average bandwidth we have seen in any game we have tested. Average utilization is also quite high, and the game hits 100% SSD utilization frequently.
Swipe to scroll horizontally
Peak Bandwidth |
Average Bandwidth |
Peak Utilization |
Average Utilization |
|
SATA SSD |
485 MB/s |
240 MB/s |
100% |
52% |
PCIe 3.0 |
1324 MB/s |
301 MB/s |
100% |
50% |
PCIe 4.0 |
2956 MB/s |
374 MB/s |
100% |
30% |
PCIe 5.0 |
2761 MB/s |
307 MB/s |
100% |
19% |
Swipe to scroll horizontally
Peak Bandwidth |
Average Bandwidth |
Peak Utilization |
Average Utilization |
|
SATA SSD |
486 MB/s |
271 MB/s |
100% |
59% |
PCIe 3.0 |
1645 MB/s |
318 MB/s |
100% |
56% |
PCIe 4.0 |
2931 MB/s |
382 MB/s |
100% |
28% |
PCIe 5.0 |
2890 MB/s |
352 MB/s |
100% |
17% |
Swipe to scroll horizontally
Peak Bandwidth |
Average Bandwidth |
Peak Utilization |
Average Utilization |
|
SATA SSD |
565 MB/s |
264 MB/s |
100% |
56% |
PCIe 3.0 |
1656 MB/s |
317 MB/s |
100% |
54% |
PCIe 4.0 |
2886 MB/s |
379 MB/s |
100% |
26% |
PCIe 5.0 |
2901 MB/s |
366 MB/s |
100% |
19% |
How does this translate to performance?
Image 1 of 3
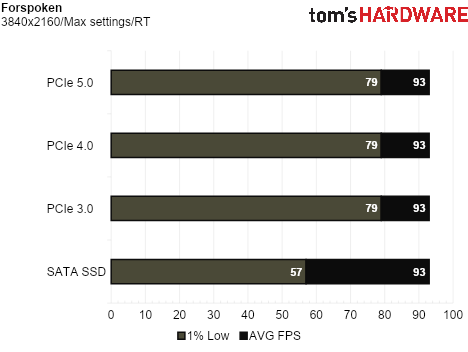
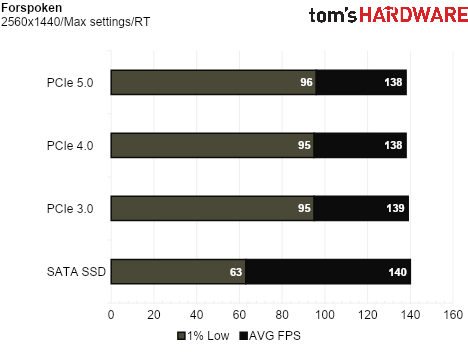
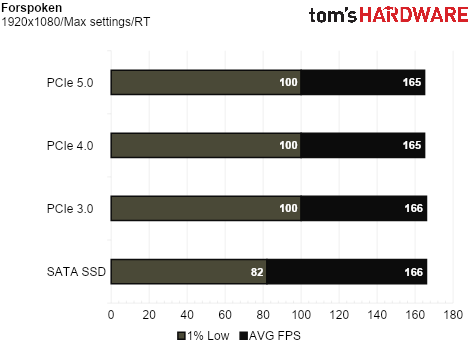
While there is no difference in performance between the PCIe NVMe SSDs, you can see that having a PCIe SSD can give you a large boost in the 1% lows compared to a SATA SSD. We see a 39% increase in 1% lows at 4K, a 51% increase at 1440p, and a 22% increase at 1080p.
The higher peak and average bandwidth used by the PCIe drives resulted in higher 1% lows in this game, which makes for a smoother gameplay experience.
Alan Wake 2
Alan Wake 2
Alan Wake 2 makes extensive use of modern rendering technologies, including path tracing, mesh shaders, and RTX Mega Geometry. In a recent interview, Remedy explained that the game operates with a fixed memory budget, continuously streaming the assets required for the current scene from the SSD while evicting assets that are no longer needed. This approach keeps memory usage under control despite the game's highly detailed textures and geometry, making Alan Wake 2 one of the most storage-intensive titles available today.
Swipe to scroll horizontally
Peak Bandwidth |
Average Bandwidth |
Peak Utilization |
Average Utilization |
|
SATA SSD |
562 MB/s |
80 MB/s |
100% |
63% |
PCIe 3.0 |
582 MB/s |
83 MB/s |
100% |
62% |
PCIe 4.0 |
572 MB/s |
82 MB/s |
91% |
14% |
PCIe 5.0 |
1047 MB/s |
83 MB/s |
100% |
13% |
Swipe to scroll horizontally
Peak Bandwidth |
Average Bandwidth |
Peak Utilization |
Average Utilization |
|
SATA SSD |
570 MB/s |
100 MB/s |
100% |
72% |
PCIe 3.0 |
938 MB/s |
113 MB/s |
100% |
62% |
PCIe 4.0 |
887 MB/s |
111 MB/s |
100% |
19% |
PCIe 5.0 |
1673 MB/s |
116 MB/s |
100% |
17% |
Swipe to scroll horizontally
Peak Bandwidth |
Average Bandwidth |
Peak Utilization |
Average Utilization |
|
SATA SSD |
572 MB/s |
212 MB/s |
100% |
85% |
PCIe 3.0 |
1435 MB/s |
214 MB/s |
100% |
76% |
PCIe 4.0 |
3045 MB/s |
225 MB/s |
100% |
38% |
PCIe 5.0 |
5128 MB/s |
223 MB/s |
100% |
32% |
The SSD activity increases with resolution in this game. We see an average of over 200 MB/s on each drive at 4K, which is rare for a game. We also see a whopping 5.1 GB/s of peak bandwidth on a PCIe 5.0 SSD at 4K.
How does this impact performance?
Image 1 of 3
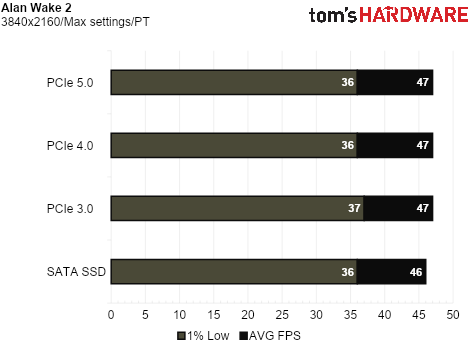
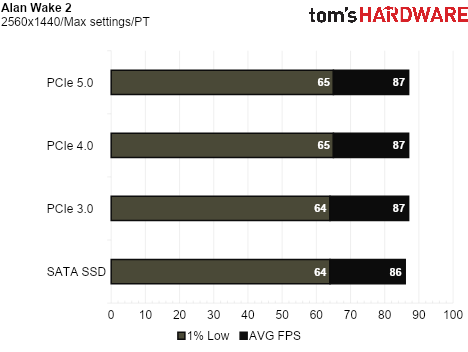
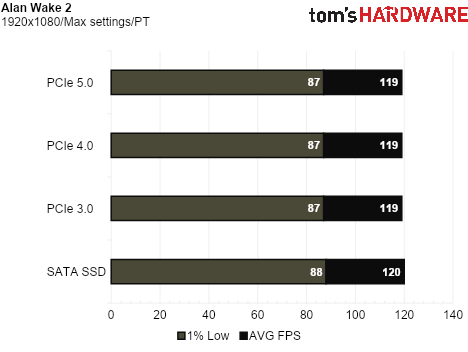
Unlike Forspoken, we do not see any difference in performance here for any of the drives tested.
Although the faster SSDs reach higher peak bandwidth, these peaks are only brief bursts rather than sustained transfers. In other words, the game is not continuously streaming multiple gigabytes of data every second. Instead, it transfers smaller amounts of data over very short intervals, resulting in high instantaneous bandwidth readings. As a result, the average bandwidth is the more meaningful metric, and it remains relatively similar across all of the SSDs we tested.
The average utilization on the SATA SSD can reach over 80% at 4K, but it is not enough to degrade its performance in comparison to the PCIe drives.
Ratchet and Clank: Rift Apart
Ratchet and Clank: Rift Apart
Swipe to scroll horizontally
Peak Bandwidth |
Average Bandwidth |
Peak Utilization |
Average Utilization |
|
SATA SSD |
505 MB/s |
61 MB/s |
100% |
16% |
PCIe 3.0 |
1045 MB/s |
60 MB/s |
100% |
13% |
PCIe 4.0 |
1039 MB/s |
58 MB/s |
51% |
2% |
PCIe 5.0 |
987 MB/s |
66 MB/s |
33% |
2% |
Swipe to scroll horizontally
Peak Bandwidth |
Average Bandwidth |
Peak Utilization |
Average Utilization |
|
SATA SSD |
512 MB/s |
62 MB/s |
100% |
15% |
PCIe 3.0 |
1039 MB/s |
62 MB/s |
100% |
14% |
PCIe 4.0 |
1208 MB/s |
61 MB/s |
71% |
3% |
PCIe 5.0 |
1798 MB/s |
61 MB/s |
52% |
2% |
Swipe to scroll horizontally
Peak Bandwidth |
Average Bandwidth |
Peak Utilization |
Average Utilization |
|
SATA SSD |
532 MB/s |
62 MB/s |
100% |
16% |
PCIe 3.0 |
1462 MB/s |
61 MB/s |
100% |
17% |
PCIe 4.0 |
1899 MB/s |
60 MB/s |
64% |
3% |
PCIe 5.0 |
2234 MB/s |
64 MB/s |
57% |
2% |
The disk bandwidth through this sequence is actually lower than the previous two games. This makes sense, as the game uses GPU decompression, which increases the effective bandwidth flowing through the PCIe bus beyond what CPU decompression would. However, this increase in effective bandwidth is not reflected in the data that is being read from disk.
When reading the performance charts below, it is important to note that PCIe SSDs reduce portal transition times by roughly 2-3 seconds compared to SATA SSDs. On SATA drives, Ratchet therefore spends more time within each portal sequence. As a result, average performance and 1% lows can generally be slightly higher on SATA SSDs, since there is less active rendering during these extended transition periods. However, there is one exception.
Image 1 of 3
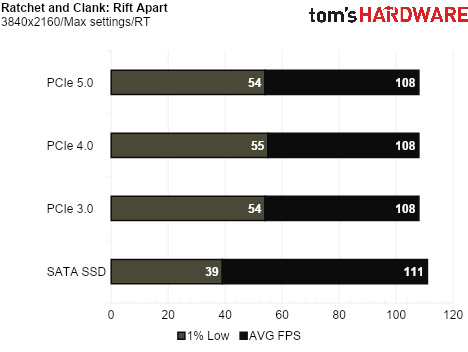
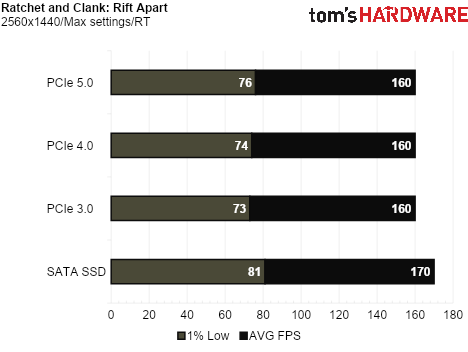
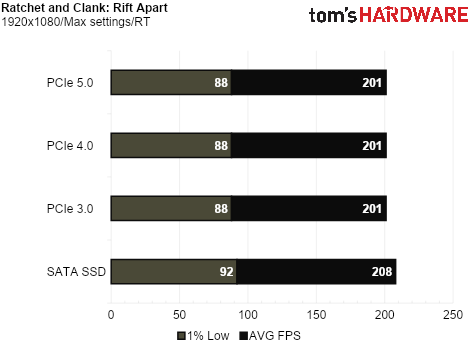
While the SATA SSD has an advantage at 1440p and 1080p due to the extended time spent inside of each portal, the 1% lows take a hit at 4K. The SATA drive does not handle the first portal transition in the sequence particularly well at 4K, and so the PCIe drives have about a 38% advantage in 1% lows.
This portal sequence is the most storage-intensive part of the game. In normal gameplay, the game uses significantly less bandwidth, and so there is no difference in performance at all between the SATA SSD and the PCIe SSDs.
Spider-Man 2
Spider-Man 2
Spider-Man 2 was the second game to use GPU decompression of assets on PC. This is the third DirectStorage title we have tested so far.
Swipe to scroll horizontally
Peak Bandwidth |
Average Bandwidth |
Peak Utilization |
Average Utilization |
|
SATA SSD |
149 MB/s |
42 MB/s |
54% |
15% |
PCIe 3.0 |
139 MB/s |
39 MB/s |
84% |
16% |
PCIe 4.0 |
144 MB/s |
43 MB/s |
43% |
9% |
PCIe 5.0 |
133 MB/s |
45 MB/s |
32% |
6% |
Swipe to scroll horizontally
Peak Bandwidth |
Average Bandwidth |
Peak Utilization |
Average Utilization |
|
SATA SSD |
150 MB/s |
40 MB/s |
45% |
12% |
PCIe 3.0 |
177 MB/s |
43 MB/s |
85% |
13% |
PCIe 4.0 |
168 MB/s |
35 MB/s |
40% |
10% |
PCIe 5.0 |
208 MB/s |
41 MB/s |
33% |
7% |
Swipe to scroll horizontally
Peak Bandwidth |
Average Bandwidth |
Peak Utilization |
Average Utilization |
|
SATA SSD |
161 MB/s |
44 MB/s |
34% |
10% |
PCIe 3.0 |
194 MB/s |
49 MB/s |
100% |
22% |
PCIe 4.0 |
187 MB/s |
46 MB/s |
44% |
12% |
PCIe 5.0 |
198 MB/s |
48 MB/s |
36% |
10% |
Since the game uses GPU decompression, the effective bandwidth after decompression will be considerably higher than what we see here, but none of the SSDs we tested are being stressed in this game.
Image 1 of 3
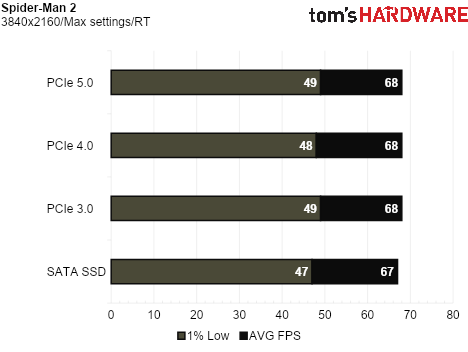
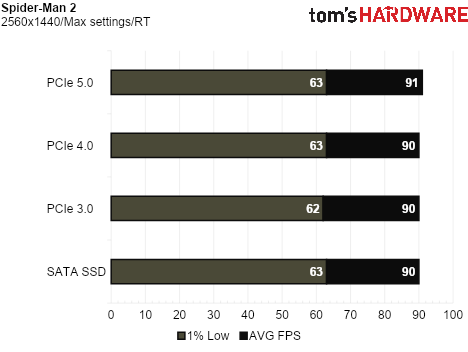
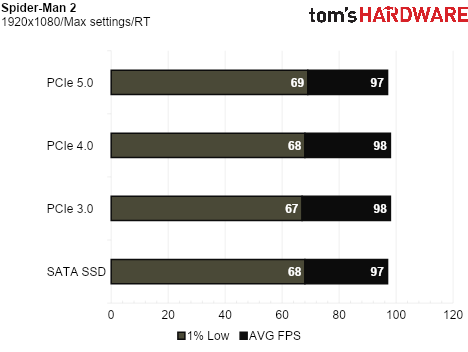
Performance is virtually identical on all drives in this game.
Starfield
Starfield
Starfield is an open world game that constantly reads data from disk. It also frequently hits 100% disk utilization as you traverse the world.
Swipe to scroll horizontally
Peak Bandwidth |
Average Bandwidth |
Peak Utilization |
Average Utilization |
|
SATA SSD |
339 MB/s |
15 MB/s |
100% |
29% |
PCIe 3.0 |
397 MB/s |
17 MB/s |
100% |
16% |
PCIe 4.0 |
434 MB/s |
17 MB/s |
100% |
7% |
PCIe 5.0 |
404 MB/s |
18 MB/s |
100% |
4% |
Swipe to scroll horizontally
Peak Bandwidth |
Average Bandwidth |
Peak Utilization |
Average Utilization |
|
SATA SSD |
395 MB/s |
19 MB/s |
100% |
28% |
PCIe 3.0 |
501 MB/s |
19 MB/s |
100% |
15% |
PCIe 4.0 |
528 MB/s |
18 MB/s |
100% |
7% |
PCIe 5.0 |
599 MB/s |
19 MB/s |
100% |
3% |
Swipe to scroll horizontally
Peak Bandwidth |
Average Bandwidth |
Peak Utilization |
Average Utilization |
|
SATA SSD |
455 MB/s |
18 MB/s |
100% |
24% |
PCIe 3.0 |
704 MB/s |
19 MB/s |
100% |
15% |
PCIe 4.0 |
813 MB/s |
20 MB/s |
100% |
6% |
PCIe 5.0 |
934 MB/s |
19 MB/s |
100% |
3% |
In previous games, 100% SSD utilization was accompanied by much higher peak bandwidth. Here, the lower peak bandwidth suggests the game uses a very low queue depth for its read operations. As you move through the open world, it continuously streams data from the SSD in frequent, small transfers, keeping average bandwidth very low.
Image 1 of 3
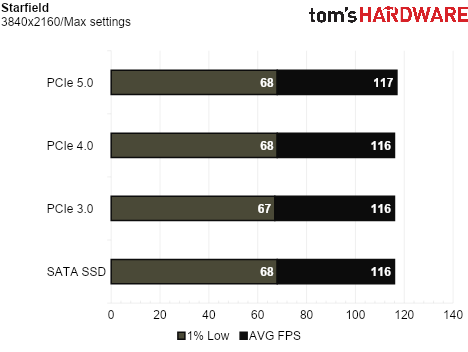
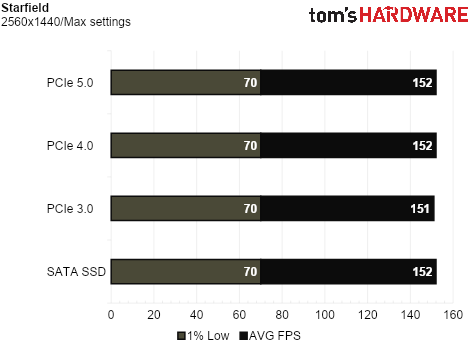
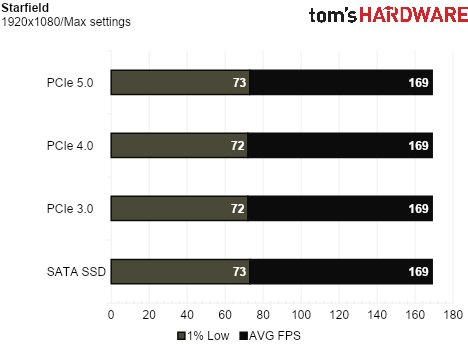
Once again, we see no improvement in performance going from the SATA SSD to any of the faster PCIe NVME SSDs.
DOOM: The Dark Ages
DOOM: The Dark Ages
DOOM: The Dark Ages was the first game to list an NVMe SSD as a requirement. Not only is it listed as such on the PC system requirements, but Bethesda has a support page that reiterates that installing the game on an NVMe SSD is required.
The developers at idSoftware mentioned that the game uses a proprietary ultra-fast continuous sector streaming tech that virtually eliminates load times between levels.
Swipe to scroll horizontally
Peak Bandwidth |
Average Bandwidth |
Peak Utilization |
Average Utilization |
|
SATA SSD |
189 MB/s |
40 MB/s |
55% |
23% |
PCIe 3.0 |
199 MB/s |
62 MB/s |
50% |
16% |
PCIe 4.0 |
212 MB/s |
61 MB/s |
43% |
12% |
PCIe 5.0 |
208 MB/s |
63 MB/s |
34% |
10% |
Swipe to scroll horizontally
Peak Bandwidth |
Average Bandwidth |
Peak Utilization |
Average Utilization |
|
SATA SSD |
178 MB/s |
62 MB/s |
53% |
25% |
PCIe 3.0 |
248 MB/s |
69 MB/s |
53% |
17% |
PCIe 4.0 |
247 MB/s |
70 MB/s |
44% |
13% |
PCIe 5.0 |
229 MB/s |
68 MB/s |
35% |
11% |
Swipe to scroll horizontally
Peak Bandwidth |
Average Bandwidth |
Peak Utilization |
Average Utilization |
|
SATA SSD |
192 MB/s |
73 MB/s |
58% |
25% |
PCIe 3.0 |
245 MB/s |
73 MB/s |
53% |
18% |
PCIe 4.0 |
238 MB/s |
74 MB/s |
43% |
14% |
PCIe 5.0 |
287 MB/s |
73 MB/s |
38% |
11% |
The drives we tested are hardly being stressed in DOOM: The Dark Ages.
Image 1 of 3
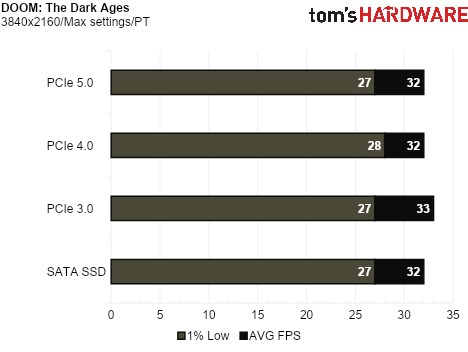
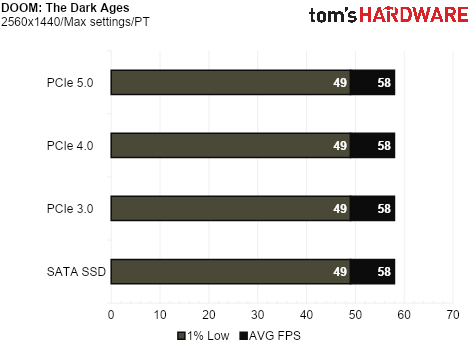
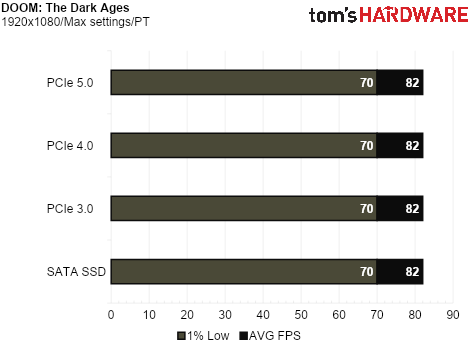
Given the disk utilization figures, it comes as no surprise that all of the tested drives deliver identical gameplay performance.
Although this article focuses on in-game performance rather than loading times, we also found little difference in load times when using a SATA SSD. Loading screens were not noticeably longer, and we observed no visual artifacts or streaming issues while playing on the slower drive.
Based on our testing, it is unclear why Bethesda lists an NVMe SSD as a requirement. A SATA SSD provided an indistinguishable gameplay experience, with no measurable performance drawbacks or observable streaming issues.
Dead Space Remake
Dead Space Remake
Dead Space Remake made headlines when it launched with abhorrent performance and stuttering issues. But how much of that was due to streaming from slower storage? Does a faster SSD help performance?
Swipe to scroll horizontally
Peak Bandwidth |
Average Bandwidth |
Peak Utilization |
Average Utilization |
|
SATA SSD |
511 MB/s |
33 MB/s |
100% |
23% |
PCIe 3.0 |
809 MB/s |
38 MB/s |
100% |
12% |
PCIe 4.0 |
788 MB/s |
39 MB/s |
100% |
7% |
PCIe 5.0 |
902 MB/s |
52 MB/s |
100% |
5% |
Swipe to scroll horizontally
Peak Bandwidth |
Average Bandwidth |
Peak Utilization |
Average Utilization |
|
SATA SSD |
562 MB/s |
38 MB/s |
100% |
26% |
PCIe 3.0 |
1003 MB/s |
34 MB/s |
100% |
14% |
PCIe 4.0 |
967 MB/s |
38 MB/s |
100% |
8% |
PCIe 5.0 |
833 MB/s |
42 MB/s |
100% |
7% |
Swipe to scroll horizontally
Peak Bandwidth |
Average Bandwidth |
Peak Utilization |
Average Utilization |
|
SATA SSD |
560 MB/s |
37 MB/s |
100% |
25% |
PCIe 3.0 |
1192 MB/s |
51 MB/s |
100% |
15% |
PCIe 4.0 |
998 MB/s |
48 MB/s |
100% |
8% |
PCIe 5.0 |
1299 MB/s |
50 MB/s |
100% |
6% |
Although average disk utilization and bandwidth are relatively low, the game frequently reaches 100% utilization. Yet even during these periods, peak bandwidth remains well below what PCIe SSDs can achieve under high-queue-depth random workloads. This indicates the game is issuing read requests at a very low queue depth, leaving much of the SSD's available performance untapped. Additionally, the difference in average bandwidth between the SSDs is minimal.
Image 1 of 3
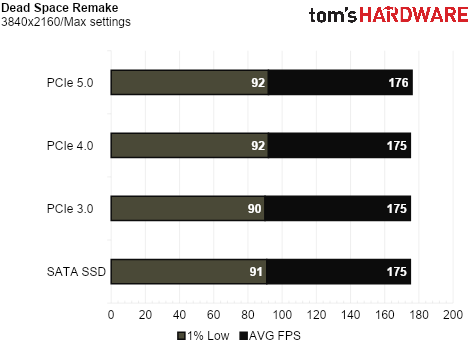
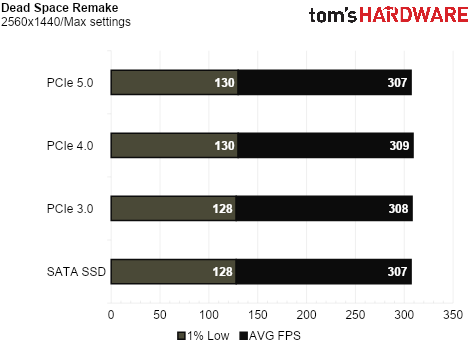
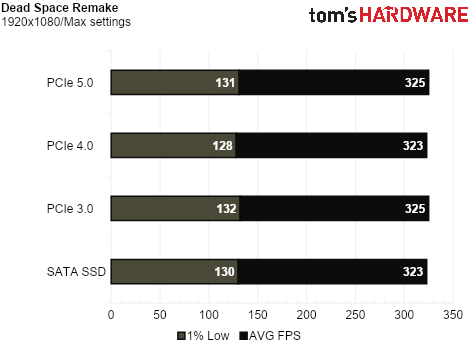
All drives provide the same performance. There is nothing to be gained from a faster SSD in this title.
Cyberpunk 2077
Cyberpunk 2077
We included Cyberpunk 2077 in our testing because the game features a large and seamless open world, and it is one of the most popular games ever released.
Swipe to scroll horizontally
Peak Bandwidth |
Average Bandwidth |
Peak Utilization |
Average Utilization |
|
SATA SSD |
40 MB/s |
7 MB/s |
11% |
2% |
PCIe 3.0 |
55 MB/s |
8 MB/s |
20% |
2% |
PCIe 4.0 |
53 MB/s |
9 MB/s |
17% |
1% |
PCIe 5.0 |
44 MB/s |
8 MB/s |
11% |
1% |
Swipe to scroll horizontally
Peak Bandwidth |
Average Bandwidth |
Peak Utilization |
Average Utilization |
|
SATA SSD |
99 MB/s |
8 MB/s |
25% |
3% |
PCIe 3.0 |
73 MB/s |
8 MB/s |
23% |
3% |
PCIe 4.0 |
63 MB/s |
8 MB/s |
18% |
1% |
PCIe 5.0 |
78 MB/s |
9 MB/s |
10% |
1% |
Swipe to scroll horizontally
Peak Bandwidth |
Average Bandwidth |
Peak Utilization |
Average Utilization |
|
SATA SSD |
121 MB/s |
12 MB/s |
29% |
4% |
PCIe 3.0 |
126 MB/s |
11 MB/s |
40% |
3% |
PCIe 4.0 |
134 MB/s |
13 MB/s |
22% |
1% |
PCIe 5.0 |
111 MB/s |
9 MB/s |
10% |
1% |
The average bandwidth is by far the lowest we have seen in the games tested so far. This is not entirely surprising. Although the game was released in the same year as the PlayStation 5 and Xbox Series X|S, development began well before those consoles were released. As a cross-generation title, it also needed to run on the previous generation of consoles, which relied on mechanical hard drives. As a result, the game's streaming system was designed to perform well on significantly slower storage devices.
Image 1 of 3
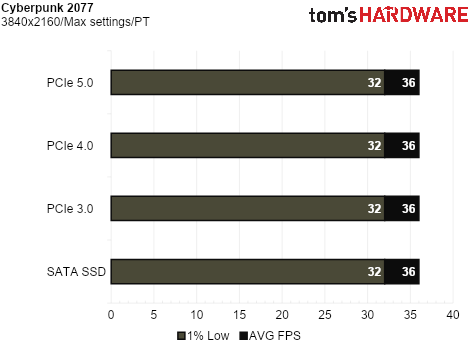
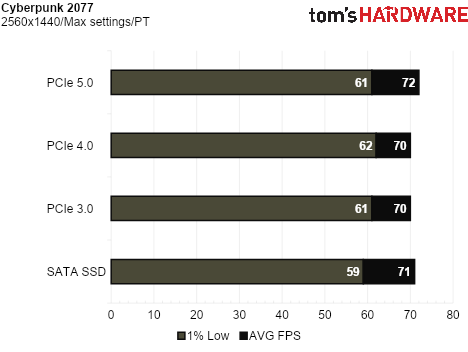
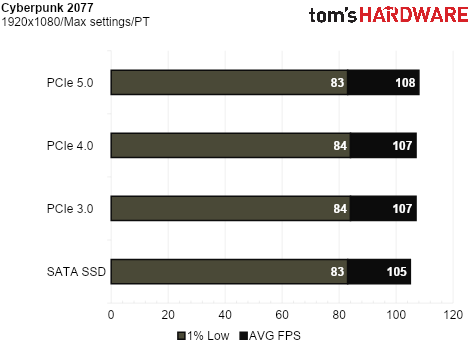
There is no noticeable difference in performance across the drives tested.
The Elder Scrolls IV: Oblivion Remastered
The Elder Scrolls IV: Oblivion Remastered modernizes the look of the original game with improved visuals. Built on Unreal Engine 5, it utilizes Nanite virtualized geometry, Lumen global illumination, and virtual shadow maps. This is an open-world game, and our first UE5 title is tested in this article.
Swipe to scroll horizontally
Peak Bandwidth |
Average Bandwidth |
Peak Utilization |
Average Utilization |
|
SATA SSD |
214 MB/s |
21 MB/s |
70% |
5% |
PCIe 3.0 |
165 MB/s |
24 MB/s |
68% |
7% |
PCIe 4.0 |
287 MB/s |
22 MB/s |
49% |
4% |
PCIe 5.0 |
267 MB/s |
26 MB/s |
28% |
3% |
Swipe to scroll horizontally
Peak Bandwidth |
Average Bandwidth |
Peak Utilization |
Average Utilization |
|
SATA SSD |
326 MB/s |
20 MB/s |
68% |
5% |
PCIe 3.0 |
266 MB/s |
31 MB/s |
66% |
7% |
PCIe 4.0 |
252 MB/s |
29 MB/s |
42% |
5% |
PCIe 5.0 |
299 MB/s |
33 MB/s |
22% |
3% |
Swipe to scroll horizontally
Peak Bandwidth |
Average Bandwidth |
Peak Utilization |
Average Utilization |
|
SATA SSD |
312 MB/s |
21 MB/s |
55% |
5% |
PCIe 3.0 |
379 MB/s |
33 MB/s |
57% |
7% |
PCIe 4.0 |
344 MB/s |
32 MB/s |
38% |
5% |
PCIe 5.0 |
433 MB/s |
42 MB/s |
27% |
3% |
None of the SSDs we tested reached 100% peak utilization and average utilization is extremely low, too.
Image 1 of 3
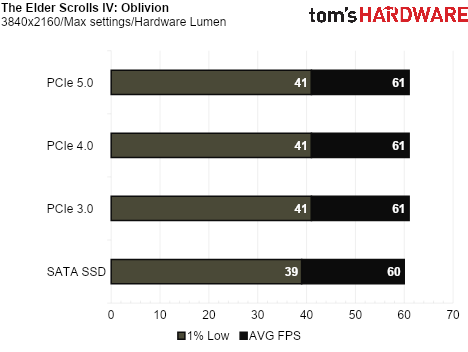
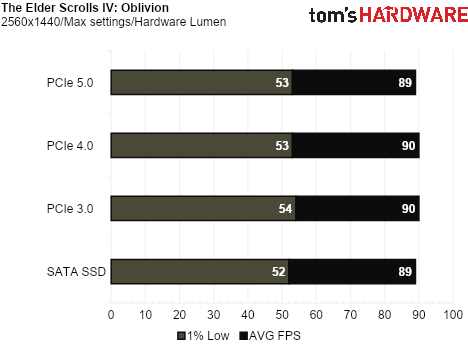
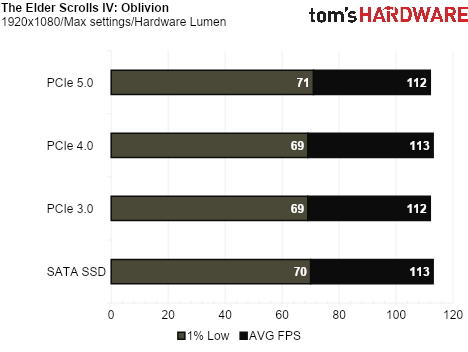
As is the case with most of the games we have tested, the SATA SSD holds its own and there is no difference in performance across all of the drives.
007 First Light
007 First Light
007 First Light is a recently released game that uses DirectStorage. In a recent interview, the developers at IO Interactive revealed that the real-time level streaming system in the Glacier engine was redesigned for 007 First Light. The new system uses dynamic loading and unloading to allow for seamless transitions between sequences.
Swipe to scroll horizontally
Peak Bandwidth |
Average Bandwidth |
Peak Utilization |
Average Utilization |
|
SATA SSD |
164 MB/s |
11 MB/s |
39% |
3% |
PCIe 3.0 |
178 MB/s |
12 MB/s |
57% |
4% |
PCIe 4.0 |
166 MB/s |
12 MB/s |
29% |
3% |
PCIe 5.0 |
171 MB/s |
11 MB/s |
19% |
3% |
Swipe to scroll horizontally
Peak Bandwidth |
Average Bandwidth |
Peak Utilization |
Average Utilization |
|
SATA SSD |
160 MB/s |
15 MB/s |
39% |
5% |
PCIe 3.0 |
181 MB/s |
16 MB/s |
52% |
6% |
PCIe 4.0 |
172 MB/s |
14 MB/s |
32% |
4% |
PCIe 5.0 |
168 MB/s |
15 MB/s |
21% |
3% |
Swipe to scroll horizontally
Peak Bandwidth |
Average Bandwidth |
Peak Utilization |
Average Utilization |
|
SATA SSD |
169 MB/s |
15 MB/s |
56% |
5% |
PCIe 3.0 |
193 MB/s |
15 MB/s |
68% |
7% |
PCIe 4.0 |
170 MB/s |
15 MB/s |
43% |
4% |
PCIe 5.0 |
202 MB/s |
16 MB/s |
24% |
3% |
It’s clear that this new streaming system does not place a heavy burden on storage devices.
Image 1 of 3
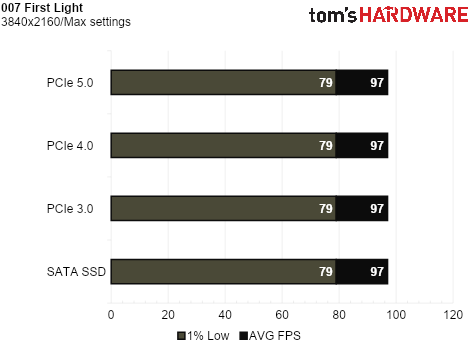
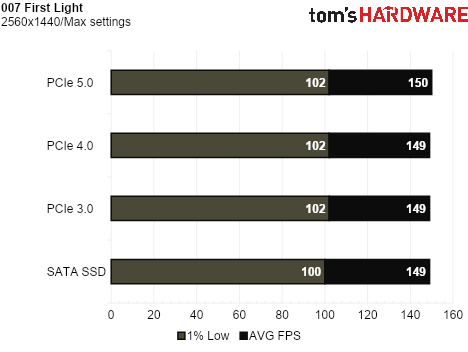
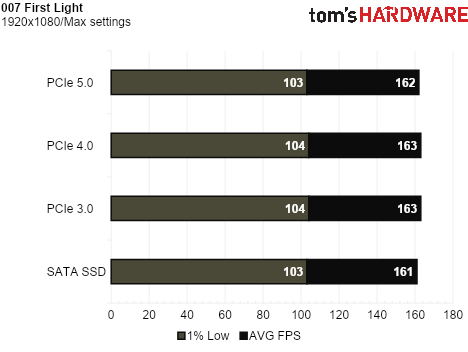
Given the I/O activity in this game, it is not surprising to see that all SSDs we tested perform the same.
F1 25
F1 25
We included F1 25 because it exhibits higher peak bandwidth and utilization than most games. The game’s high-speed driving requires rapid streaming of trackside assets, as the environment changes quickly and the player covers large distances in very short periods of time.
Swipe to scroll horizontally
Peak Bandwidth |
Average Bandwidth |
Peak Utilization |
Average Utilization |
|
SATA SSD |
523 MB/s |
47 MB/s |
94% |
9% |
PCIe 3.0 |
498 MB/s |
60 MB/s |
89% |
6% |
PCIe 4.0 |
473 MB/s |
62 MB/s |
78% |
5% |
PCIe 5.0 |
515 MB/s |
59 MB/s |
71% |
4% |
Swipe to scroll horizontally
Peak Bandwidth |
Average Bandwidth |
Peak Utilization |
Average Utilization |
|
SATA SSD |
515 MB/s |
70 MB/s |
75% |
14% |
PCIe 3.0 |
499 MB/s |
70 MB/s |
72% |
8% |
PCIe 4.0 |
474 MB/s |
75 MB/s |
66% |
6% |
PCIe 5.0 |
587 MB/s |
79 MB/s |
62% |
5% |
Swipe to scroll horizontally
Peak Bandwidth |
Average Bandwidth |
Peak Utilization |
Average Utilization |
|
SATA SSD |
554 MB/s |
79 MB/s |
71% |
15% |
PCIe 3.0 |
541 MB/s |
83 MB/s |
68% |
9% |
PCIe 4.0 |
523 MB/s |
88 MB/s |
54% |
6% |
PCIe 5.0 |
602 MB/s |
89 MB/s |
51% |
5% |
The game exhibits higher peak and average bandwidth than many of the games we have tested, but it is still not enough to truly stress a SATA SSD.
Image 1 of 3
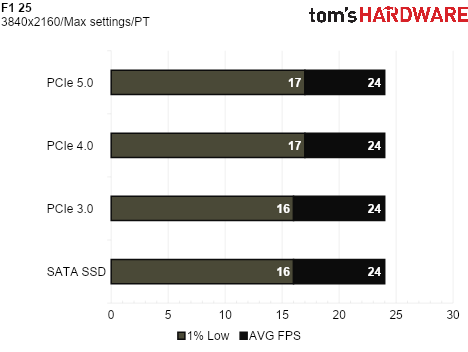
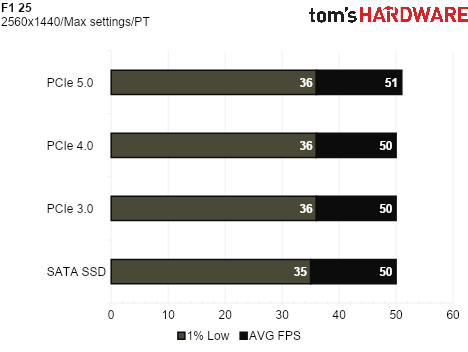
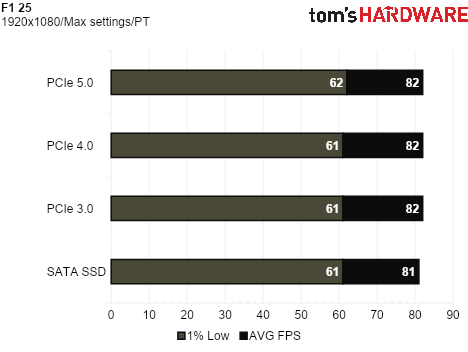
Once more, all of the drives show identical performance.
What About the Visuals?
What About the Visuals?
Many readers may be wondering if playing on a SATA drive resulted in any visual anomalies, such as slower loading textures, additional pop-in, or other visual artifacts. We did not notice any such issues in the 11 games we tested. There are some games that exhibit pop-in, but that is consistent across all storage devices. All of the drives we used in our testing provided an identical visual experience.
The Verdict
The Verdict
Out of all the games tested, only two showed measurable performance differences between SATA and PCIe SSDs: Forspoken and Ratchet & Clank: Rift Apart.
In Forspoken, moving from a SATA SSD to any PCIe SSD – regardless of generation – resulted in a significant improvement in 1% lows.
Ratchet & Clank: Rift Apart showed more nuanced results. During the portal sequences at 1440p and 1080p, average framerate and 1% lows were slightly higher on the SATA SSD, as slower loading increased the time spent inside the portals. Since the portals contain less on-screen complexity, framerates are naturally higher within them. However, at 4K resolution, PCIe SSDs delivered better 1% lows. Outside of the portal sequence in normal gameplay, there was no measurable performance difference between any of the drives.
Across all other titles, PCIe SSDs provided no meaningful performance advantage, and there were no observable differences between PCIe generations. In the vast majority of games tested, a SATA SSD delivers comparable performance.
MORE: Best SSDs
MORE: Best External SSDs






 English (US) ·