
TLDR:
- SUI is trading at $1.0651, sitting 17.6% below its 200-day moving average resistance level of $1.2873.
- RSI has recovered from extreme oversold levels to a neutral 51, leaving room for price to move in either direction.
- MACD has not crossed bullish yet, but the narrowing gap between lines signals building momentum below the surface.
- CryptoQuant data shows large orders clustering at $0.90–$1.00, pointing to whale accumulation ahead of a potential rebound.
SUI is trading at $1.0651, sitting 17.6% below its 200-day moving average of $1.2873. The token dropped from $4.00 to $0.50 over four months before stabilizing.
Technical analysts are now watching closely as momentum indicators show early signs of recovery. Meanwhile, on-chain data from CryptoQuant points to large-order accumulation near key support zones. The chart structure tells a more layered story than the price decline alone suggests.
Technical Indicators Point to a Market in Transition
SUI printed a capitulation bottom near $0.50 in late 2025. Volume spiked sharply at those lows, which typically marks seller exhaustion rather than continued distribution. That kind of price action usually separates a dying asset from one completing a base.
Since that bottom, the Relative Strength Index has climbed from extreme oversold territory back to 51. That reading is neutral — not extended to the upside, and not under further selling pressure. It gives the chart room to move in either direction.
Analyst account @2xnmore noted that the MACD has not crossed bullish yet, but the gap between the MACD line and the signal line is narrowing.
$SUI fell from $4.00 to $0.50 in four months.
Most people who bought it stopped looking at the chart.
Here is what the chart actually shows right now:
– Price is at $1.0651.
– The 200-day moving average is at $1.2873.
– That 17.6% gap between price and the MA is the entire… pic.twitter.com/7QtIw3XFOH
— 2xnmore (@2xnmore) May 17, 2026
The momentum engine is building without having triggered a confirmed buy signal. That is an important distinction.
The 200-day moving average at $1.2873 remains the key structural line. A high-volume daily close above that level would shift the chart from bearish to neutral.
A MACD crossover on top of that would then move the structure from neutral to bullish. Neither has happened yet.
Whale Order Data Suggests Accumulation at the $0.90–$1.00 Zone
On-chain researcher Rei Researcher referenced CryptoQuant’s Spot Average Order Size data to track large-player behavior.
The data shows large-volume orders clustering around the $0.80–$1.00 range during market lulls, without pushing price lower. That pattern has preceded rebounds before.
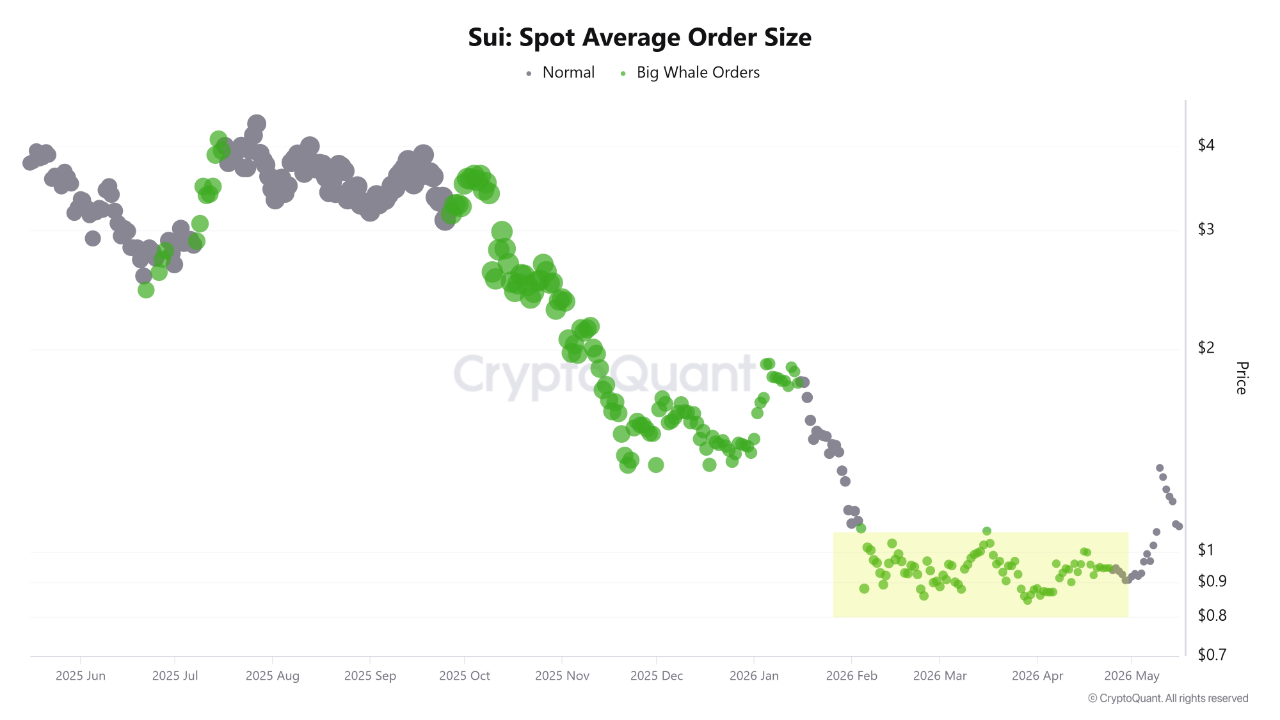
Source: Cryptoquant
The $0.90–$1.00 zone appears to function as a solid support band. When large orders repeatedly fill at that level without breaking it, it suggests institutional positioning rather than exit. That behavior contrasts with panic-driven retail selling at cycle lows.
If SUI corrects back toward that range and large-order activity increases, analysts consider it a bullish signal for the next move higher. The re-fill pattern at that level is what traders are now watching for on future dips.
The broader picture is that SUI remains in a technical rebuild phase. Price is below the 200-day MA, but the base structure and whale footprint both suggest the selling pressure has already been absorbed at lower levels.


 English (US) ·