
Key Highlights
- Spot Solana ETFs saw their largest weekly capital inflows since late February, totaling $39.23 million in net flows.
- Open interest in SOL futures contracts surged 29.5%, climbing from $4.94 billion to $6.4 billion within a two-week period.
- SOL posted a 15% gain over seven days, hitting $97, as market participants set their sights on $120 as the next major resistance.
- Technical analyst CryptoPatel highlighted that the downtrend on SOL/BTC has been invalidated, with $89–$91 emerging as critical support.
- An inactive whale wallet re-emerged after seven months, purchasing 67,648 SOL valued at $6.23 million.
The spot ETF market for Solana delivered its strongest performance in months last week. Combined net inflows reached $39.23 million, with Bitwise’s BSOL ETF commanding the lion’s share at $36 million. Fidelity’s FSOL contributed an additional $1.8 million. From inception, BSOL has accumulated $861 million in inflows, representing roughly 81% of the $1.06 billion total across all spot SOL exchange-traded funds.
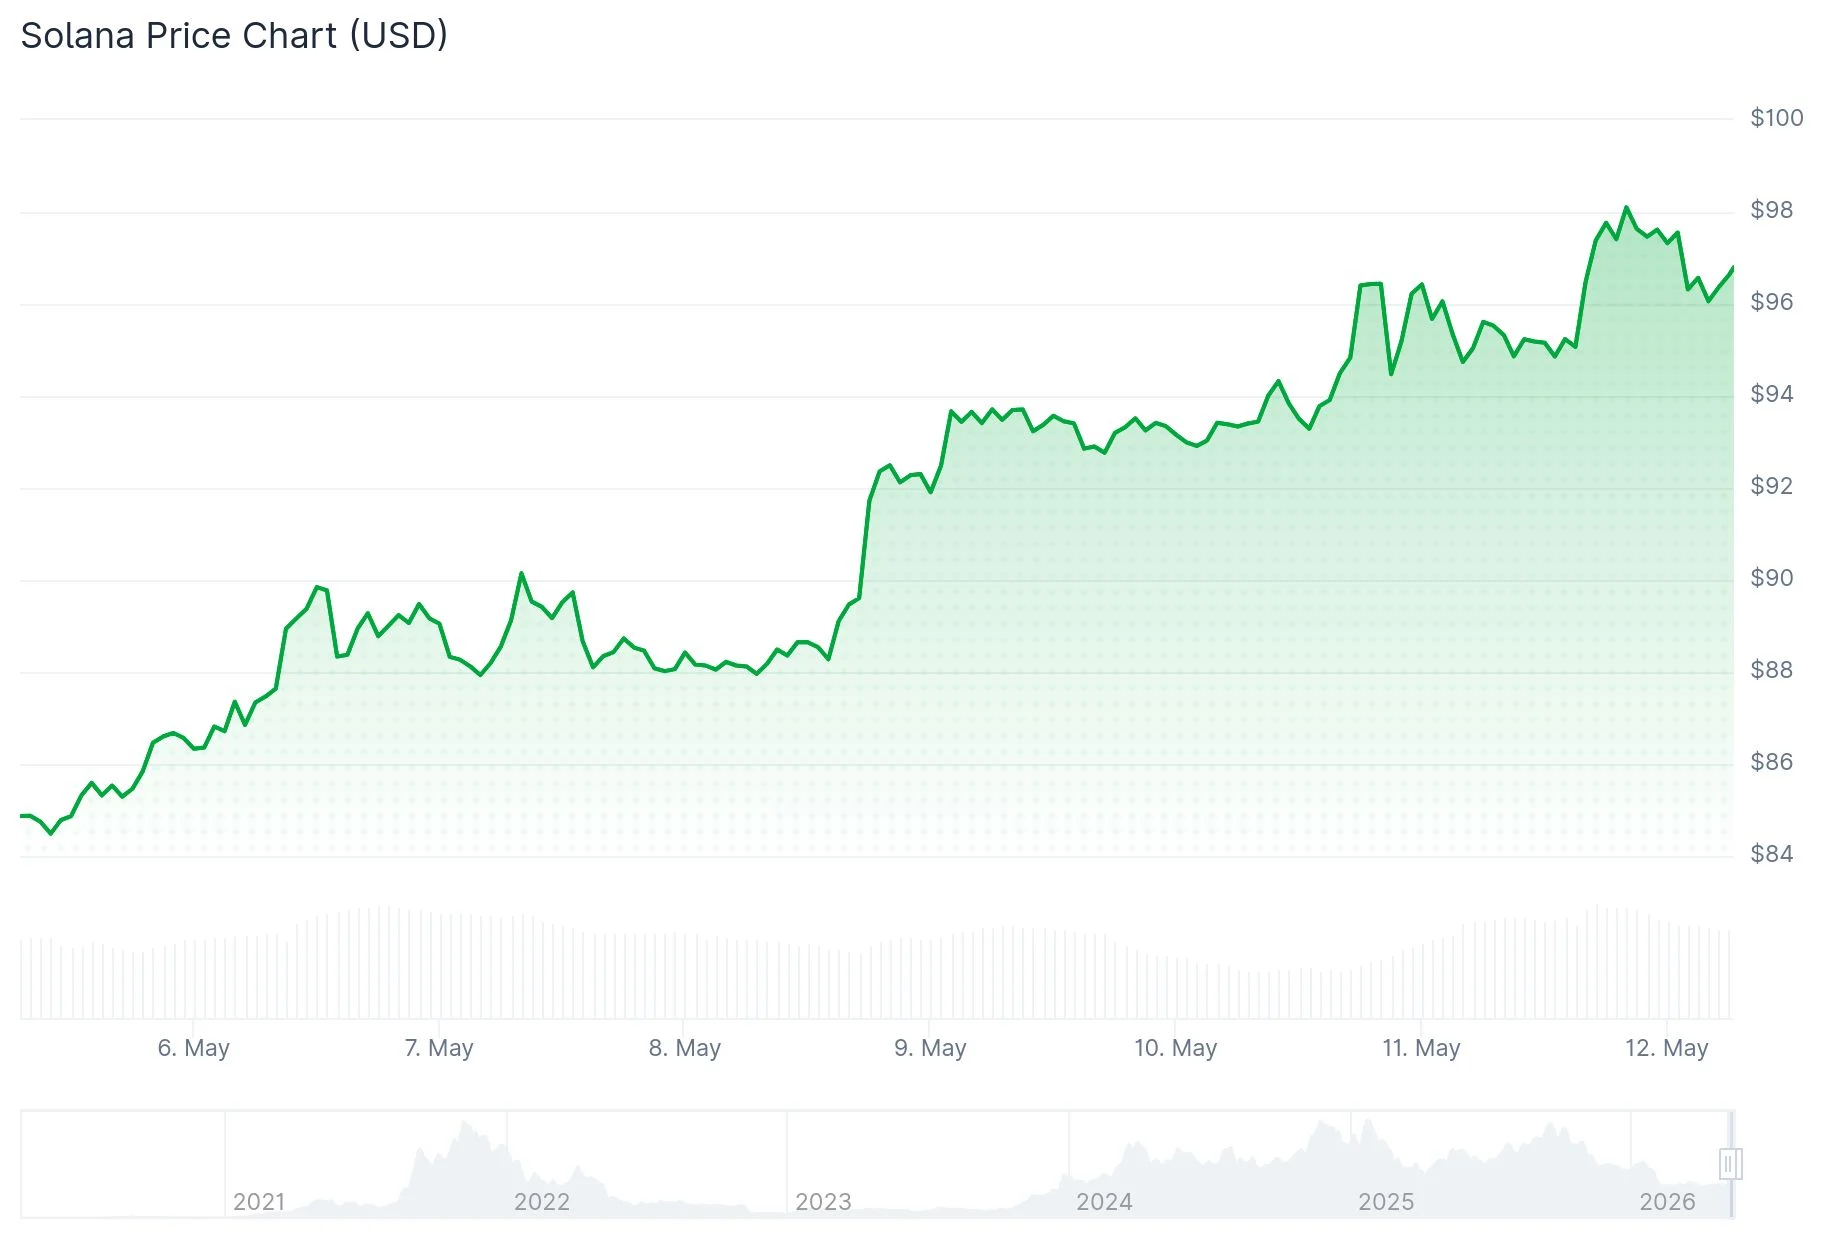 Solana (SOL) Price
This institutional interest coincided with explosive growth in derivatives markets. Open interest for Solana futures vaulted from $4.94 billion on May 1 to $6.4 billion—a 29.5% increase in less than 14 days. Spot cumulative volume delta climbed to nearly $250 million from $163 million over just five days as SOL approached the $96 mark.
On the futures side, CVD expanded to approximately $593.6 million, indicating strong buyer absorption of selling pressure across both spot and derivatives venues. The funding rate maintained levels around 0.065%, confirming that leveraged traders were willing to pay premiums to maintain long positions.
Crypto analyst CryptoPatel shared on X that SOL had endured “9 long months” of decline but emphasized the chart had finally flipped bullish. “The downtrend is broken and buyers are stepping in strong,” he stated, noting that patience was being rewarded. Meanwhile, analyst BATMAN observed that SOL recently cleared a 231-day downtrend line on the SOL/BTC daily timeframe, signaling strengthening performance relative to Bitcoin.
$SOL Was Bleeding for 9 Long Months. Today, the chart finally turned. The downtrend is broken and buyers are stepping in strong. 🚀
Patience is paying off. pic.twitter.com/vA4Wu0z4qC
— Crypto Patel (@CryptoPatel) May 11, 2026
On-Chain Movement and Institutional Accumulation Build Momentum
Blockchain data provided additional support for the bullish thesis. A wallet tagged as Emb5o became active again after a seven-month dormancy, acquiring 67,648 SOL tokens worth roughly $6.23 million, alongside 6.2 million JUP tokens.
Collectively, the eight spot Solana ETFs now control nearly 2% of SOL’s total circulating supply. This institutional accumulation continues to tighten available supply, a dynamic that has fueled much of the narrative around professional investor interest. Adding to ecosystem growth, Alchemy unveiled a $20 million developer fund for Solana on April 9, providing infrastructure resources and credits to teams building on the platform.
 Source: SoSoValue
Network metrics showed improvement throughout May, with notable increases in daily active addresses and transaction counts. Solana-based meme tokens experienced a resurgence in trading volume following a UFO-themed speculation wave, which boosted decentralized exchange activity and elevated demand for SOL as transaction fees.
Critical Technical Levels Ahead
Solana has successfully broken above its 100-day exponential moving average for the first time since October 2025. The price action is developing an Adam and Eve pattern around the $95 resistance zone, with the pattern’s measured move projecting a target near $120.
Analyst BATMAN identified the $89–$91 range as the closest support cluster. The $90 level is particularly significant as it represents the breakout confirmation for near-term momentum traders. A breakdown below this threshold would likely test the 200-day moving average positioned around $86.74.
At press time, SOL was changing hands in the $93–$97 range. Traders are closely monitoring for a confirmed daily close above $95, which would potentially unlock the path toward the $120 objective.
✨ Limited Time Offer
Get 3 Free Stock Ebooks
Discover top-performing stocks in AI, Crypto, and Technology with expert analysis.
- Top 10 AI Stocks - Leading AI companies
- Top 10 Crypto Stocks - Blockchain leaders
- Top 10 Tech Stocks - Tech giants


 English (US) ·