
 2 hours ago
3
2 hours ago
3
TLDR
- Solana (SOL) is trading near $117.38 after testing the $120 area for the first time in about eight months.
- Analyst Ash Crypto points to a weekly golden cross forming after SOL reclaimed its 200-week moving average.
- GordonGekko says a sustained reclaim of $118 could open a move toward $148.
- SOL open interest has climbed to about $2.97 billion, according to Santiment data.
- Solana processed 76% of all x402 transactions and holds a 35% share of tokenized equity volume.
Solana (SOL) is trading near $117.38 after a strong recovery from its recent lows. The price hit a session high of $119.90, putting it right at the $118 to $120 resistance zone.
SOL is down 0.13% over the last 24 hours. This is the first time the token has tested $120 in about eight months.
Earlier this year, SOL fell as low as $60. It then spent July and the first half of August trading in a range between about $70 and $82.
Buying picked up in the last week of August, and the price broke out of that range. SOL later climbed to a local peak of $119.43.
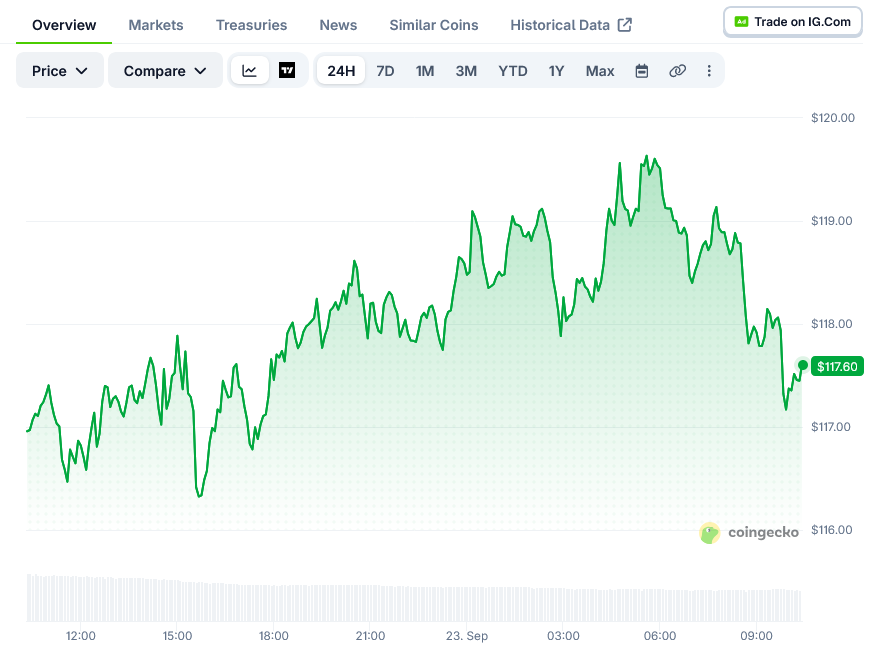 Solana Price on CoinGecko
Analysts Point to Golden Cross and Breakout Levels
Analyst Ash Crypto shared a weekly chart on X showing SOL has moved back above its 200-week moving average. He pointed to a weekly golden cross that is forming, which he sees as a possible sign of a larger trend reversal.
The golden cross has not been confirmed yet. If SOL is rejected at the upper moving average, the price could move sideways before trying again.
Analyst GordonGekko said on X that a sustained reclaim of $118 could trigger a move toward $148. His chart shows SOL bouncing from a base near $96 before rising to current resistance.
If SOL falls back below $118, the $110 to $112 area comes into focus. On the daily chart, the 20-day EMA sits near $105.59, according to TradingView data.
Analyst JAVON MARKS said on X that SOL has broken out of a long-term Cup and Handle pattern. He noted the pattern points to a target above $500, though this reflects the full measured move of the pattern rather than a set forecast.
Another analyst, Sweep, compared SOL’s current base near $95 to $100 with an earlier accumulation phase that came before a large rally. His fractal chart projects a path toward $400 to $500 over a much longer timeframe.
Open Interest and Network Activity Rise
Derivatives activity is also picking up. Data shared by Santiment Intelligence on X shows SOL open interest at about $2.97 billion.
The same data puts Bitcoin open interest near $25.84 billion and Ethereum at $16.97 billion. The figures show traders are adding leverage across the market as prices recover.
On the network side, SolanaFloor reported on X that Solana’s share of tokenized equity trading volume rose to 35%. That is its highest level in two months.
The figure puts Solana close to Robinhood, which holds a 39% share. Solana had trailed further behind in July.
Solana’s official X account also shared data on x402 payments. It said the network processed 76% of all x402 transactions, totaling 23.2 million in four weeks.
The second-largest network handled about 3.39 million x402 transactions over the same period.
SOL was last seen near $117.38, just under the $118 level that analysts are watching.
The post Solana (SOL) Price: Analysts Watch $118 Level With $148 Target in View appeared first on Blockonomi.







 English (US) ·