
 2 hours ago
12
2 hours ago
12
Key Takeaways
- Solana is currently positioned at $75.27, maintaining strength above crucial $74.50 support
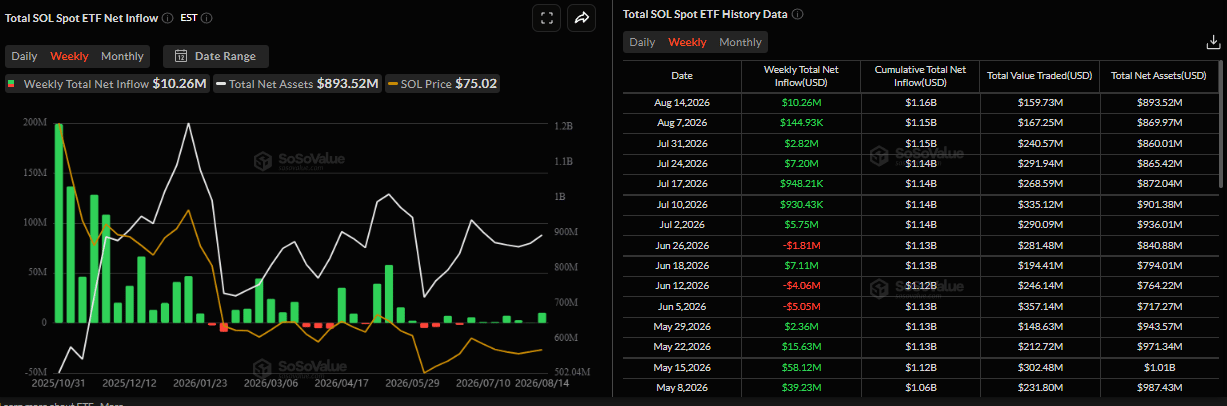
- Spot SOL ETFs listed in the United States attracted $10.26 million last week, extending inflows to seven weeks
- Technical analysis reveals a falling wedge formation on the 4-hour timeframe with breakout potential toward $77.10
- Momentum indicators show RSI hovering around neutral 52 while MACD remains in bullish territory
- Breaking below $73.64 on a daily close could trigger further downside pressure
Solana maintains stability above the $75 threshold as both technical chart formations and institutional capital flows suggest measured bullish sentiment. The digital asset was changing hands at $75.27 during recent trading, registering approximately $2.27 billion in 24-hour trading activity against a market capitalization near $43.86 billion. Price action showed a marginal decline of roughly 0.1% over the previous day.
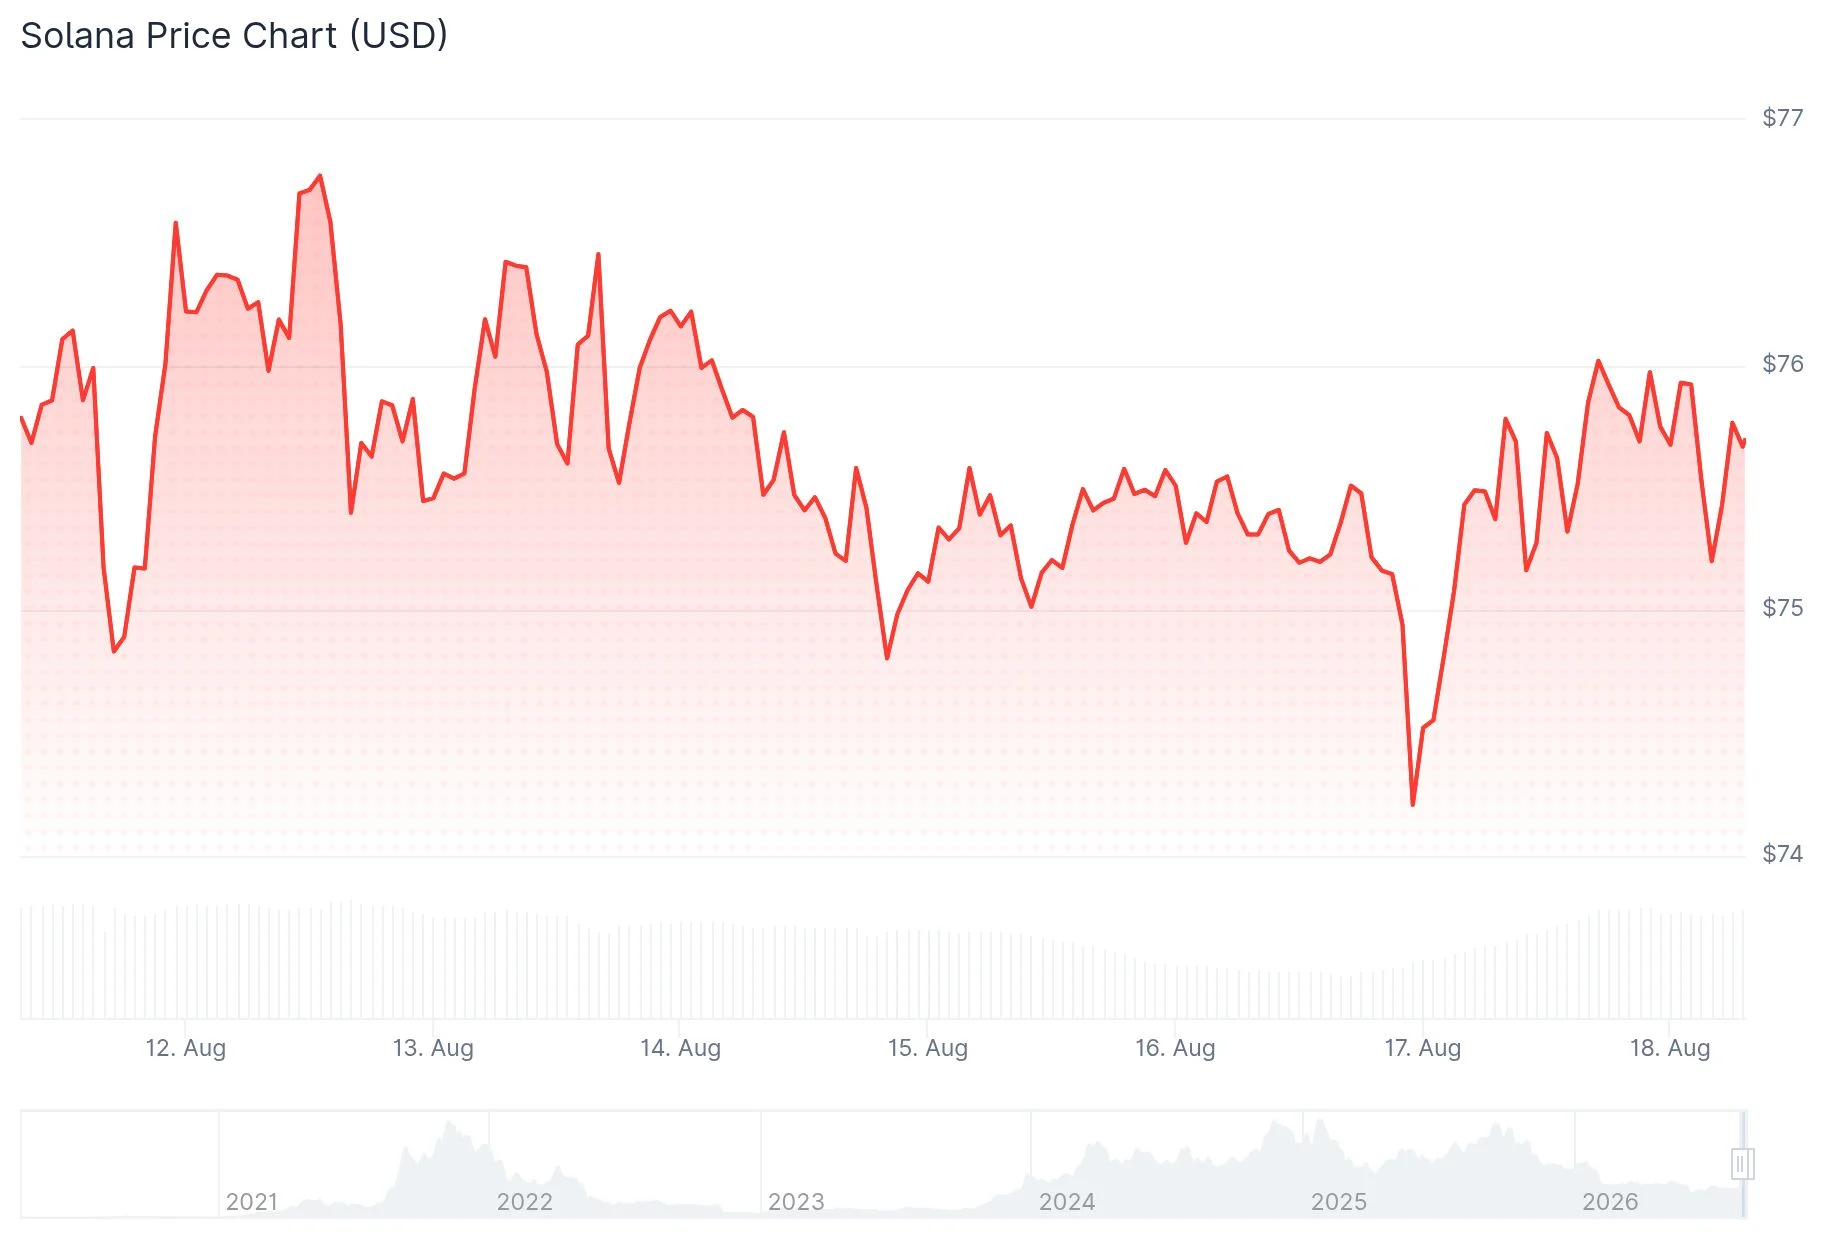 Solana (SOL) Price
Following a 2.18% retreat during the prior week, the cryptocurrency has established support along an upward-sloping trendline. Current trading levels position SOL marginally beneath the 50-day Exponential Moving Average (EMA), which stands at $75.48.
Market observer Bluntz commented via X platform regarding “strong pa on $SOL,” suggesting the asset appears “somewhat boring” due to what he characterizes as an ongoing accumulation period. His analysis highlights a weekly bullish divergence that could be signaling a bottom formation.
Seventh Consecutive Week of Positive ETF Activity
Institutional appetite has demonstrated consistency. SoSoValue tracking shows US-based spot SOL exchange-traded funds absorbed $10.26 million in new capital during the past week. This represents the strongest weekly performance since May 22 and continues an unbroken seven-week sequence of net positive flows.
 Source: SoSoValue
Additional insights from CryptoQuant indicate modest bullish positioning, with significant whale activity detected in spot trading venues while futures markets show signs of cooling. Other blockchain metrics present a neutral outlook.
Looking at longer-term moving averages, the 100-day EMA is positioned at $78.10, while the 200-day EMA rests considerably higher at $88.69. These levels continue to function as resistance zones, containing the broader price trajectory within a defined range.
Technical Pattern Develops on Shorter Timeframe
Analysts at Alpha Crypto Signal identified on August 17 a falling wedge configuration taking shape on Solana’s 4-hour chart. This pattern is characterized by price movement between two converging downward-sloping lines creating a narrowing channel — a technical formation frequently associated with upward breakouts.
SOL is currently trading in proximity to the middle Bollinger Band positioned at $74.50. The upper boundary is located at $77.10 while the lower band sits at $71.91.
Momentum indicators reveal the MACD histogram reading 0.10329, with the MACD line registered at 0.05374 against a signal line of -0.04955, indicating strengthening momentum conditions.
A decisive move above the wedge’s upper resistance line, accompanied by expanding volume, would establish $77.10 as the initial bullish objective. Conversely, losing grip on the $74.50 level would compromise the short-term technical outlook and bring $71.91 into consideration.
Solana has not yet validated a breakout scenario. Upcoming trading sessions will prove critical in establishing directional bias.
The post Solana (SOL) Maintains $75 Support as ETF Demand Extends Winning Streak to Seven Weeks appeared first on Blockonomi.







 English (US) ·