
XRP has finally broken out of months of consolidation, reclaiming critical levels against both USDT and BTC. This breakout comes as broader market sentiment shifts bullish, with Ethereum and Bitcoin also showing strong rallies.
Volume and momentum are backing the move, but traders should stay alert for potential profit-taking or short-term pullbacks following such sharp advances.
By Shayan
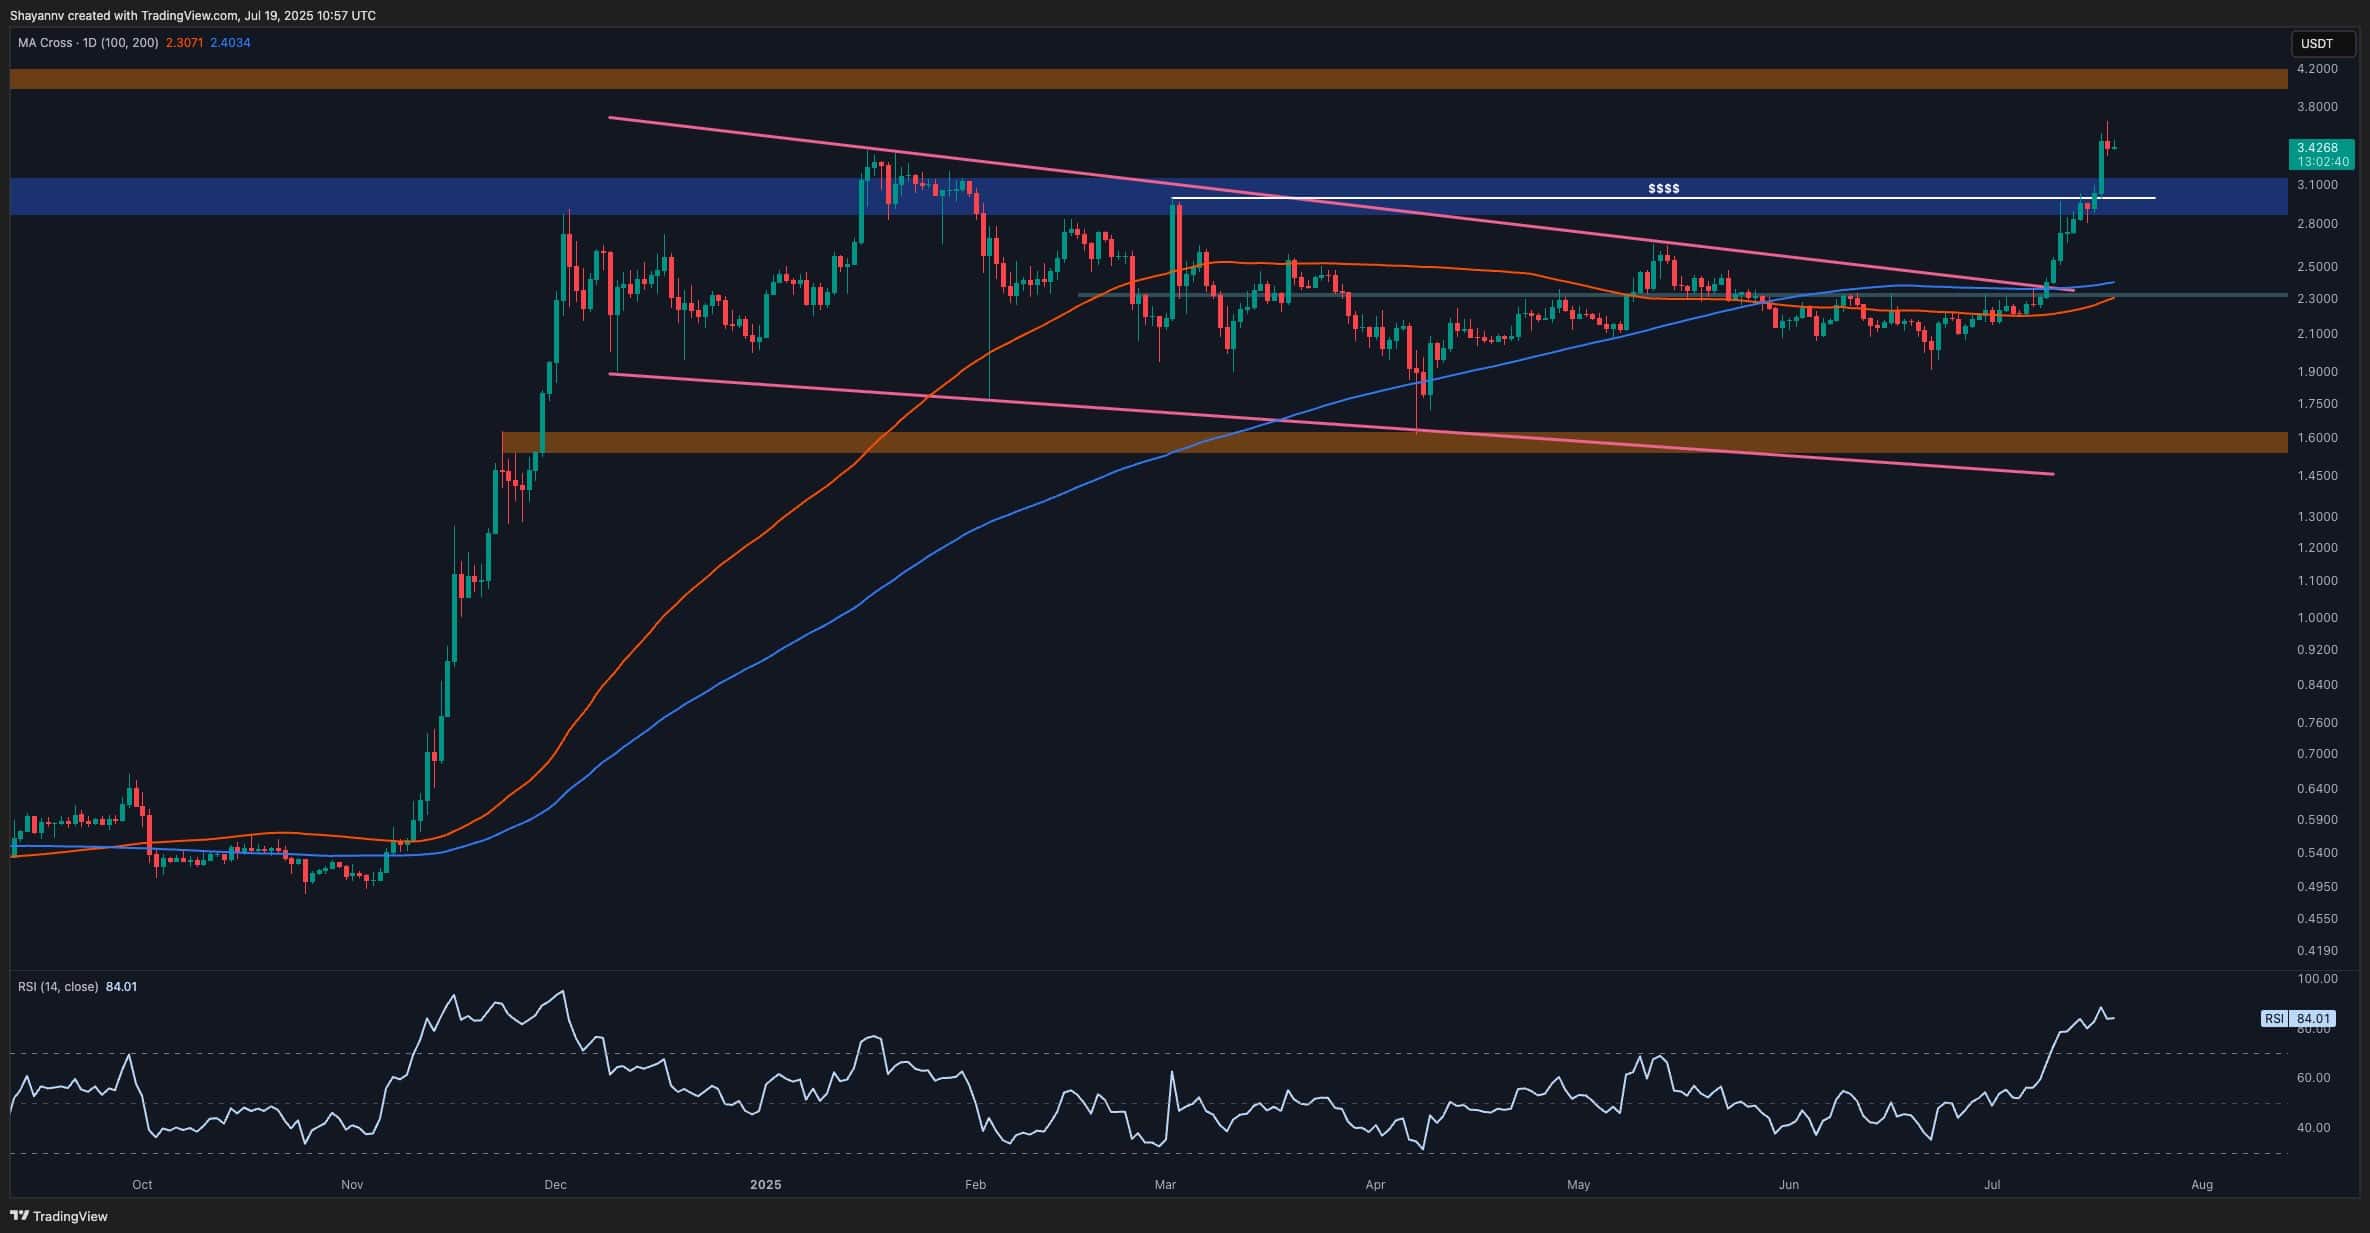
XRP/USDT Analysis
Against USDT, XRP has smashed through the long-standing $3.00 resistance zone, which had previously acted as a ceiling during several failed breakout attempts.
The move was clean and impulsive, with the price now pushing toward the $4.00 psychological resistance level. This is the next major mark to watch, as it is likely a potential target for many buyers. The RSI is also sitting above 80, showing strong momentum, but also flashing caution for potential short-term overextension.
Looking at the structure, XRP broke above the descending wedge that had capped price action for the past 6 months.
This shift marks a clear change in market character. As long as the XRP price stays above the $3.00 region, buyers are in control. A deeper retracement into the breakout zone could offer a high-probability retest entry. Losing $3.00 again, however, would invalidate the breakout and suggest a return to the range.
 Source: TradingView
XRP/BTC Analysis
The XRP/BTC pair has surged impressively, breaking above the key 2,500 SAT high and the 200-day moving average located nearby. It is now testing the upper boundary of a major supply zone around 3,000 SAT.
This level previously acted as a distribution zone several times during earlier rallies and has now become the battleground between buyers and profit-takers. The XRP price has also created a fair value gap just below the current price, which could act as a short-term support to help push the price through the 3,000 SAT zone.
Moreover, the RSI is currently hovering around 88, suggesting overheated conditions that may lead to short-term cooling. If XRP holds above the 2,500 SAT region, the bullish structure remains intact, and continuation above the 3,000 SAT resistance band becomes likely.
However, any rejection from 3,000 SAT could trigger a pullback to retest the 200-day moving average around 2500 SAT.
 Source: TradingView
Binance Free $600 (CryptoPotato Exclusive): Use this link to register a new account and receive $600 exclusive welcome offer on Binance (full details).
LIMITED OFFER for CryptoPotato readers at Bybit: Use this link to register and open a $500 FREE position on any coin!
Disclaimer: Information found on CryptoPotato is those of writers quoted. It does not represent the opinions of CryptoPotato on whether to buy, sell, or hold any investments. You are advised to conduct your own research before making any investment decisions. Use provided information at your own risk. See Disclaimer for more information.
Cryptocurrency charts by TradingView.


 English (US) ·