

ChatGPT has always been good at explaining things in plain language, but its newest trick goes a step further. Instead of presenting equations as static text, the chatbot now generates interactive diagrams that respond when you tweak the numbers.
OpenAI has launched this new feature with more than seventy core math and science topics available from the start. After spending some time experimenting with the feature, I found that watching the math move makes it feel far more intuitive.
Article continues below
Seeing math
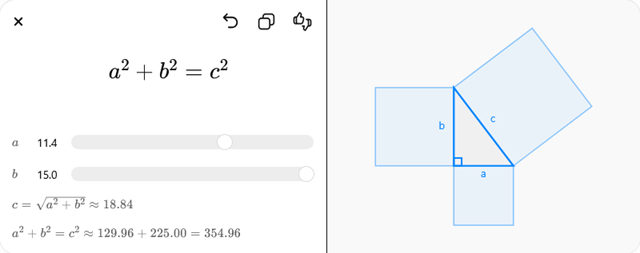
I decided to experiment with the new feature, starting with a dependable classic —the Pythagorean theorem. I asked ChatGPT for help understanding the equation, and it produced a handy explanation with a right-angled triangle drawn beside it.
Sliders let me stretch the two shorter sides of the triangle while the longest side adjusted automatically. Watching the squares built on each side change size made the famous relationship between the numbers suddenly obvious.
I then shifted to coordinate geometry. The distance formula often appears as a compact equation in textbooks, but the reasoning behind it is not always obvious. So, I asked ChatGPT to help me visualize the distance between two points on a graph.

Dragging the points around the grid instantly changed the length of the connecting line. The calculated distance was updated beside the diagram as the points moved. Sliding one point diagonally across the grid showed the distance increasing rapidly, while shifting it horizontally or vertically produced a slower change.
The visual explanation described how the horizontal and vertical differences combine through the Pythagorean theorem to determine the total distance. Seeing the line stretch across the grid made the formula feel like a geometric measurement rather than an arbitrary string of symbols.
Probable learning
I then turned to the perennially confusing world of probability, using the familiar scenario of flipping coins. But not just one — I asked ChatGPT to demonstrate how independent events work, using the likelihood of a coin landing on heads on the first or second flip as an example. The explanation appeared with a visual chart showing the results of simulated coin tosses.
The control lets you change the probability of the two events, showing where they overlap. For something like coin flips, where the odds of landing on heads are even on every toss, that makes all four squares of probability equal.

What struck me most during these tests was how natural the experience felt. Asking ChatGPT for help produced something closer to a miniature lesson than a static answer. Each visualization encouraged experimentation in a quiet way. Moving sliders or dragging points around the screen quickly revealed how the equations behaved.
That sense of experimentation may turn out to be the most valuable part of the feature. Instead of presenting math as a collection of rules to memorize, the system encourages exploration.
Follow TechRadar on Google News and add us as a preferred source to get our expert news, reviews, and opinion in your feeds. Make sure to click the Follow button!
And of course you can also follow TechRadar on TikTok for news, reviews, unboxings in video form, and get regular updates from us on WhatsApp too.


 English (US) ·