
 7 hours ago
13
7 hours ago
13
Key Takeaways
- Ethereum maintains position above the critical $1,825 support zone following a decisive break of resistance, with bullish targets set at $2,500
- U.S. spot Ethereum ETFs recorded their second consecutive week of positive flows, accumulating $105.44 million in net inflows
- Aggregate assets under management in Ethereum ETFs climbed to $9.97 billion, approaching the significant $10 billion threshold
- The ETH/BTC trading pair is challenging the upper limit of a 12-month downward channel
- Market analyst Ali Charts identifies $1,850 as the critical support level that must hold for a rally toward $2,300
Ethereum is currently changing hands near $1,865 following a notable rebound from its June bottom around $1,505. Throughout July, the digital asset has established a pattern of ascending peaks and troughs, leaving market participants focused on whether momentum can carry prices beyond the $2,000 threshold.
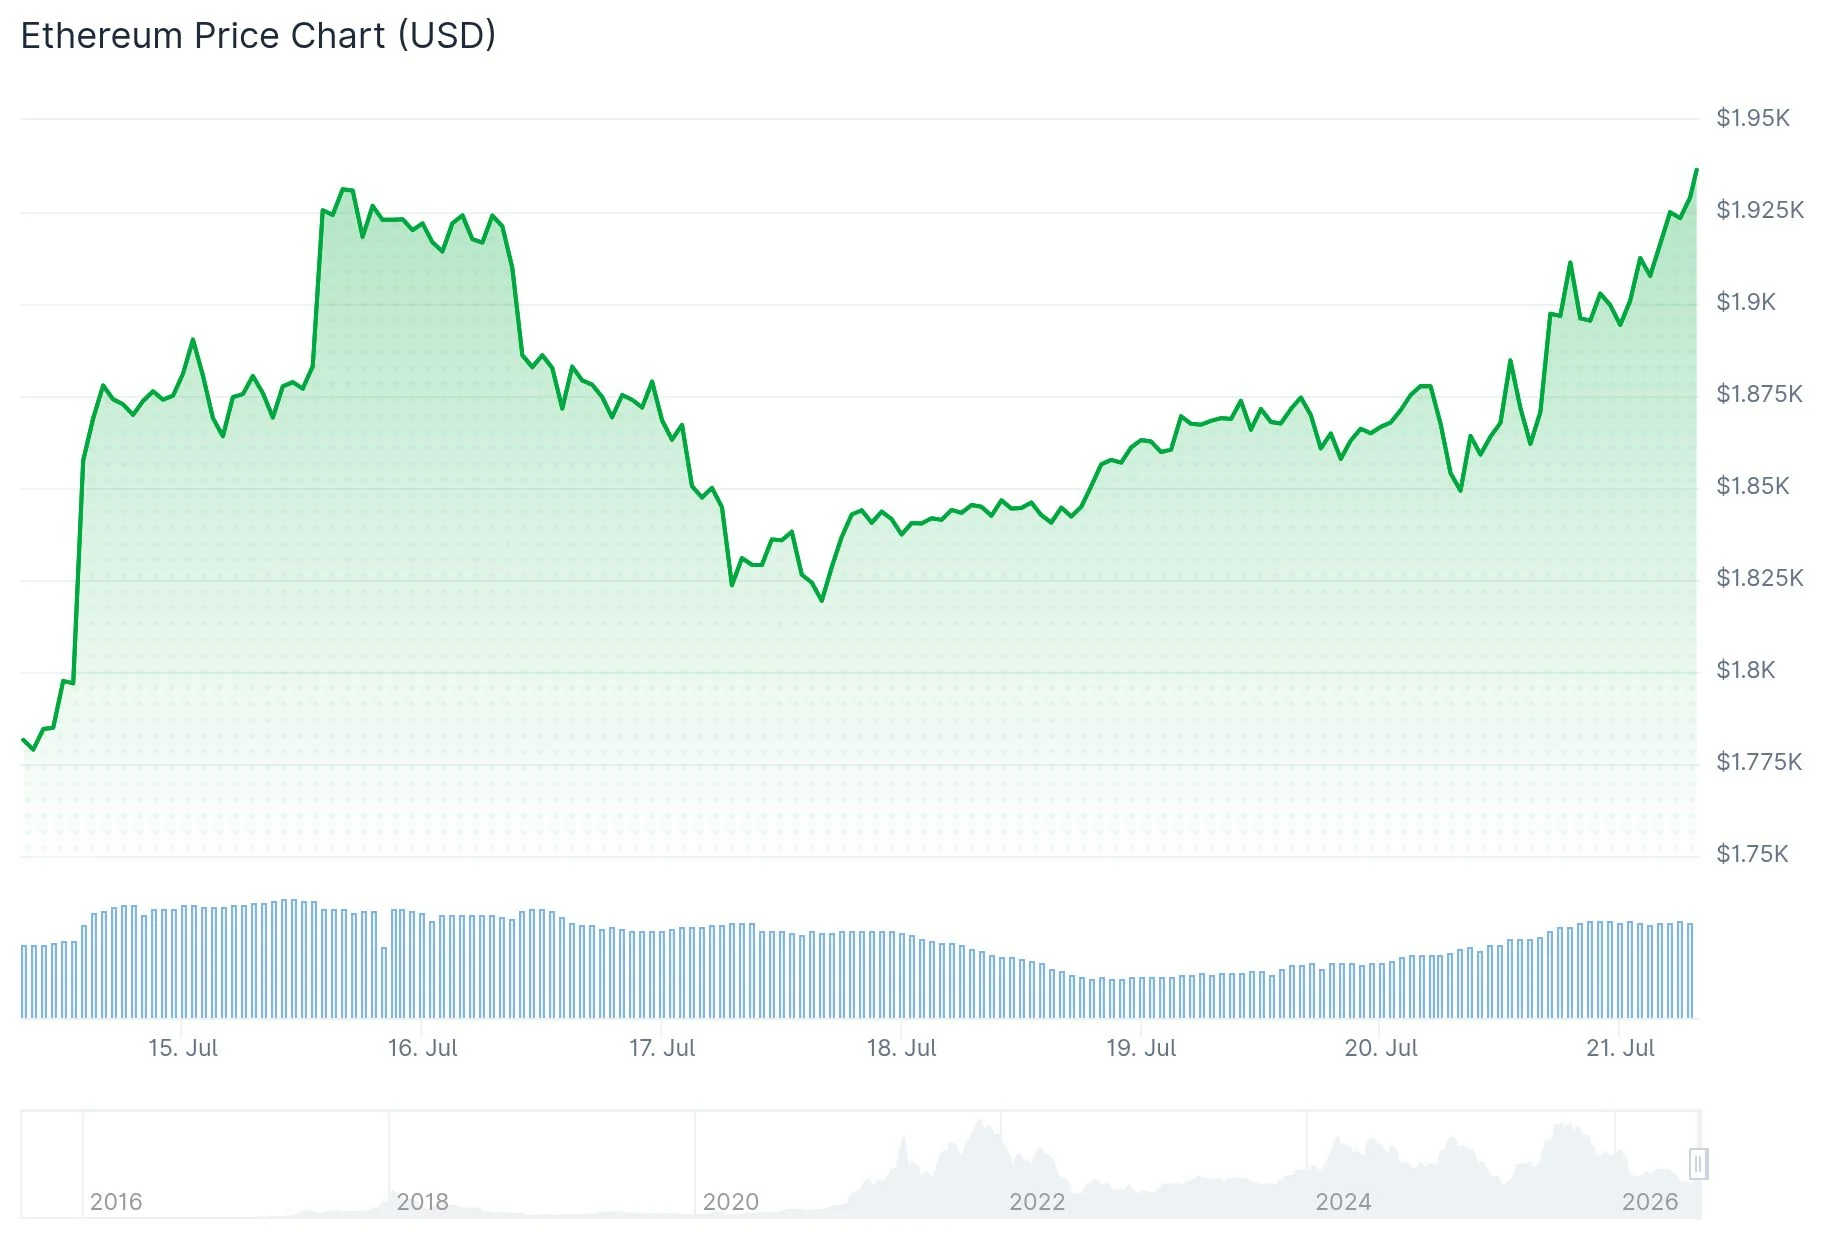 Ethereum (ETH) Price
The nearest overhead resistance barrier is positioned at $1,900. Successfully breaching this level would place the psychologically significant $2,000 milestone directly in view, representing a previous supply zone that buying pressure must overcome to validate the ongoing recovery trend.
Should ETH maintain its footing above $1,825 while continuing to establish progressively higher lows, market analysts project a potential advance toward the $2,465-$2,620 range. The extended bullish objective zone is mapped between $2,500 and $2,620.
Market analyst Ali Charts indicated that should Ethereum be constructing a double bottom pattern, the $1,850 level represents a critical support threshold. Ali Charts emphasized that maintaining this floor would open the door to a subsequent rally targeting $2,300.
Technical analyst Ted Pillows observed that ETH has successfully recaptured its 6-month descending trendline and that the weekly MACD indicator has reversed into bullish territory. He highlighted that prominent investor Tom Lee alongside various institutional players continue accumulating positions, suggesting that sustained support at $1,850 may fuel an additional 10% upward move.
Institutional Capital Returns Via ETF Channels
U.S. spot Ethereum exchange-traded funds captured $105.44 million in net positive flows during the week concluding July 17, building on the prior week’s $84.42 million intake. This marks a reversal from five straight weeks of net redemptions that occurred between mid-May and the end of June.
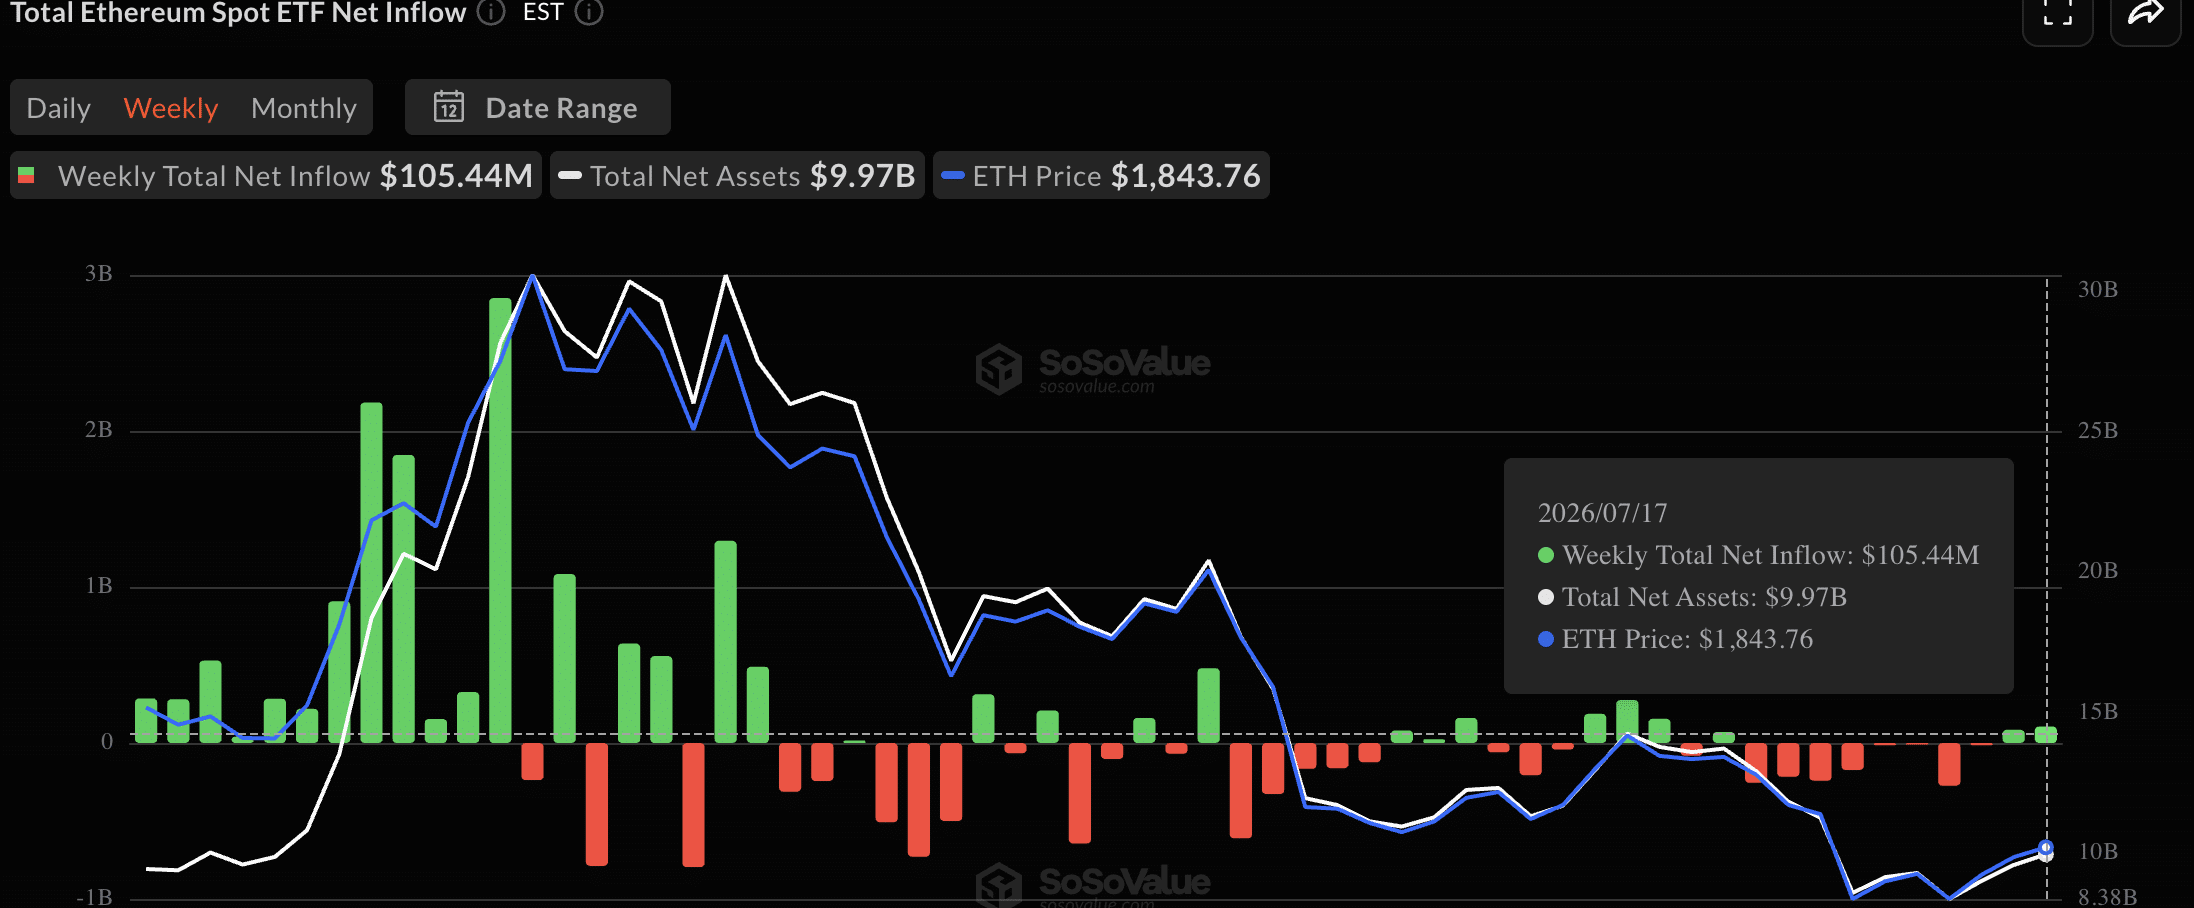 Source: SoSoValue
Total cumulative net inflows across all Ethereum ETF products now register at $11.08 billion. Combined assets held by these funds reached $9.97 billion, positioned just beneath the $10 billion benchmark.
BlackRock’s ETHA product dominated inflows, attracting $31.68 million on July 17 by itself and currently overseeing $5.22 billion in net assets, representing over half of the entire U.S. spot Ethereum ETF marketplace. Fidelity’s FETH contributed an additional $5.05 million during the same period.
Ethereum vs. Bitcoin: Momentum Shift Emerging
The ETH/BTC ratio is currently testing the upper constraint of a yearlong descending channel formation near the 0.0285-0.029 BTC range. The pair bounced from long-term support around 0.0262 BTC, and a confirmed breakout above resistance could propel it toward 0.030 BTC initially, with 0.032 BTC as the subsequent target.
A durable upward movement in the ETH/BTC ratio would likely catalyze positive momentum throughout the broader Ethereum ecosystem and associated tokens.
Examining the weekly chart, the Relative Strength Index hovers around 40, demonstrating recovery from oversold territory but remaining beneath the neutral 50 threshold. On the daily timeframe, RSI has advanced to 58.
The $1,800 level has emerged as the primary support zone to monitor. BlackRock’s ETHA fund registered $31.68 million in single-day inflows on July 17, representing the latest session with published data.
The post Ethereum (ETH) Price Rally Gains Momentum as ETF Inflows Surge Past $100M appeared first on Blockonomi.








 English (US) ·