
Quick Overview
- ETH has climbed back above $2,080 with immediate resistance positioned at $2,150
- The $2,000 zone serves as crucial support — a breach could spark significant long liquidations
- Breaking through $2,150–$2,180 resistance may unlock upside targets at $2,220–$2,350
- Multi-year chart reveals an ascending channel pattern originating from 2022
- Analyst Ali Charts identifies $1,551 and $1,070 as important support zones if the channel structure fails
Ethereum has reclaimed the $2,080 level following a rebound from depths near $2,017. The asset successfully cleared a significant bearish trendline at $2,065 on the one-hour timeframe and currently holds above its 100-hour Simple Moving Average.
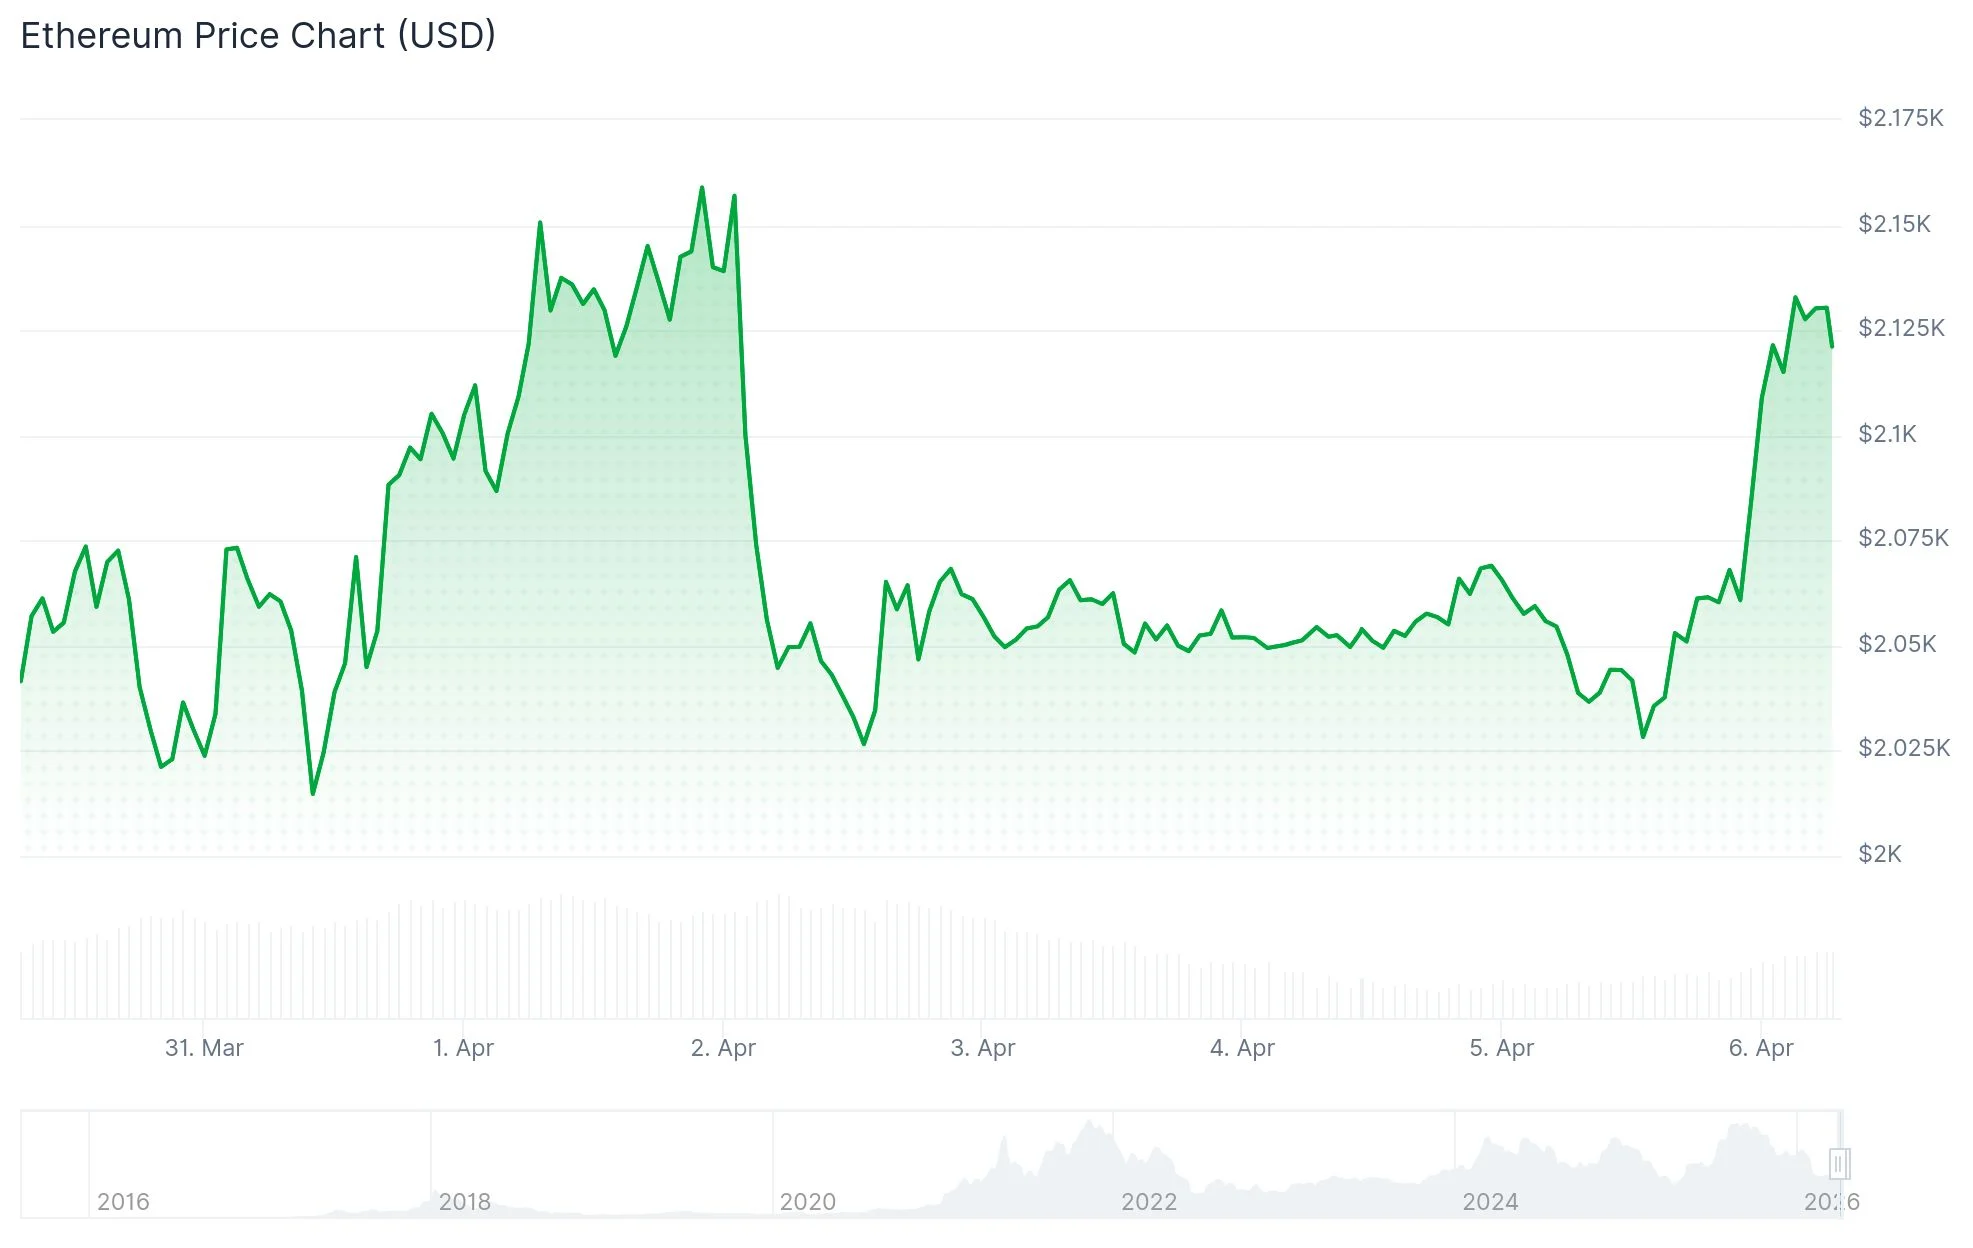 Ethereum (ETH) Price
This upward movement carried ETH beyond the 50% Fibonacci retracement mark calculated from the swing high of $2,168 down to the $2,017 bottom. The asset now approaches the 83.2% Fibonacci level around $2,140, which aligns with a significant resistance area.
Traders are closely monitoring the $2,150 threshold. This price point has prompted reactions on multiple occasions, establishing it as a prominent short-term obstacle. For bullish continuation, a decisive move above this barrier is essential.
Should ETH successfully breach $2,150, attention shifts to $2,180 as the subsequent resistance point. Clearing that hurdle could expose $2,220, with extended targets reaching $2,350 and $2,380.
Downside Scenarios if $2,150 Holds
In the event that resistance at $2,150 proves insurmountable, first support emerges at $2,080, with $2,065 following closely. Losing ground below $2,065 would likely send ETH back toward $2,020, while deeper levels at $1,980 and $1,965 await beneath.
$ETH has been going sideways for now.
For an upside move, Ethereum needs to break above the $2,100-$2,150 level.
Meanwhile, if ETH loses the $2,000 level, a huge long liquidation wipeout will happen. pic.twitter.com/9cURSLExZ4
— Ted (@TedPillows) April 4, 2026
Market analyst Ted highlighted the significance of the $2,000 zone. A breakdown beneath this psychological threshold could unleash substantial liquidations, given the concentration of leveraged long positions clustered around that price. Such forced liquidation activity might accelerate downward momentum toward $1,755 or potentially $1,693.
The near-term outlook presents a clear binary scenario. Ethereum appears poised either for an upward breakout above $2,150 or faces the prospect of steeper declines should $2,000 support crumble.
Broader Timeframe Maintains Constructive Outlook
Taking a wider perspective, analyst James Easton UK presented a chart illustrating Ethereum trading within an expansive ascending channel established in 2022. The lower boundary has successfully absorbed multiple significant pullbacks, with demand consistently emerging near channel support.
The upper channel boundary has likewise been tested during rallies, forming a framework where substantial corrections haven’t compromised the overarching trend. This structure remains valid provided the rising support trendline continues to hold.
Analyst Ali Charts noted on X that assuming ETH maintains its channel position, $1,551 and $1,070 represent important support thresholds worth tracking beneath current valuations.
As of April 6, 2026, Ethereum has gained 0.55% and trades above $2,080, with the $2,150 resistance representing the next crucial challenge for buyers.


 English (US) ·