
Key Takeaways
- Ethereum is currently priced at $2,160.46, reflecting a daily decline of 1.95%
- ETH remains above its 50-day moving average at $2,100.87 but trades significantly below the 200-day moving average of $3,204.32
- BlackRock introduced its staked ETH ETF (ETHB) in March, enhancing institutional accessibility
- Ethereum spot ETFs recorded approximately $385 million in net inflows during a six-day period in March
- Open interest in ETH derivatives jumped approximately 8–9% within 24 hours, surpassing $30 billion
Ethereum is currently changing hands at $2,160.46, marking a decline of $43.01 or 1.95% from the previous close. The trading session began at $2,203.46, with price action contained within a range of $2,143.22 to $2,233.69 throughout the day.
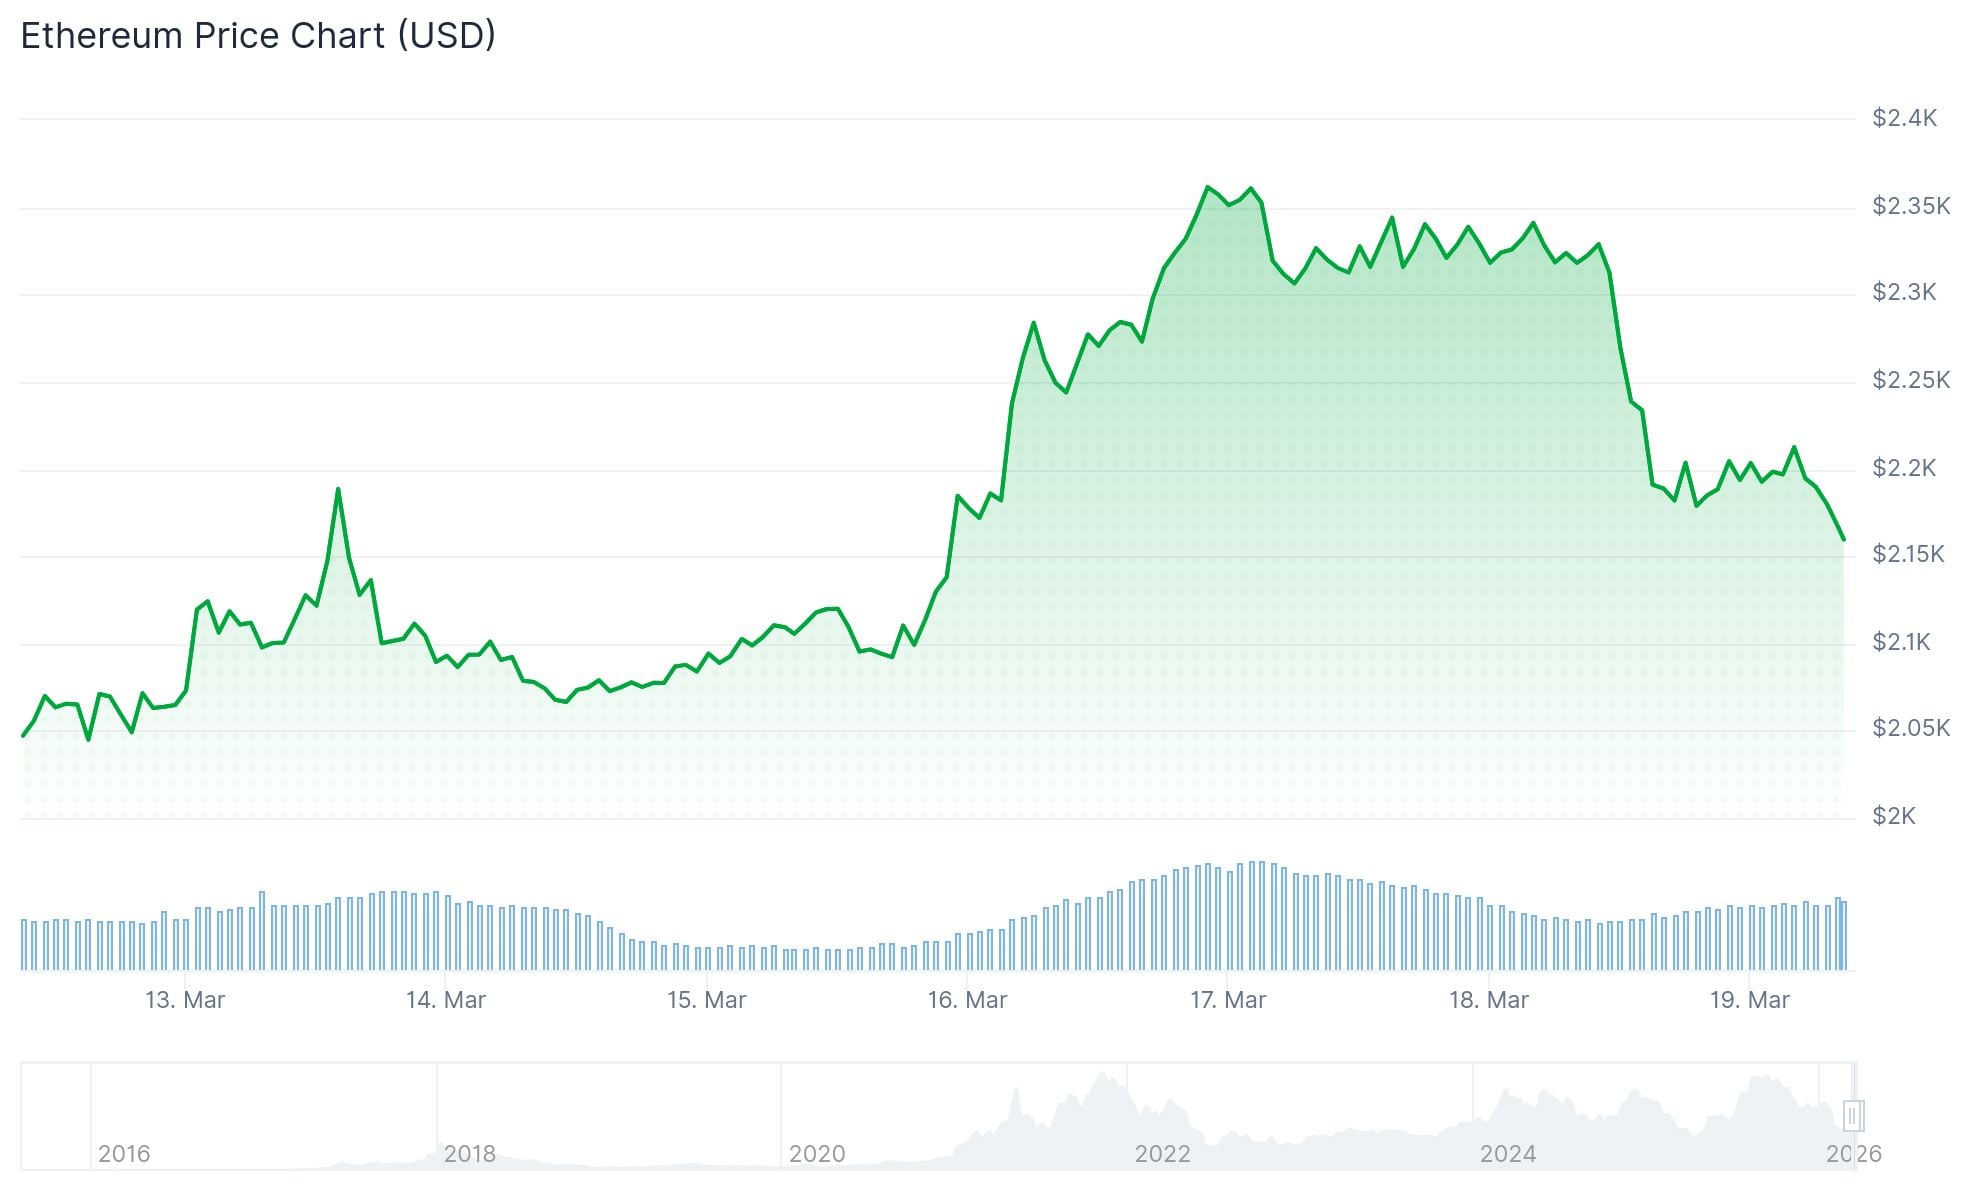 Ethereum (ETH) Price
This pullback comes after several weeks of gains that lifted ETH from the $2,000 threshold. Despite today’s retreat, Ethereum maintains gains of approximately 8–10% compared to early-month price levels. Trading volume remains subdued at roughly 71 million dollars, well below the typical daily average of 343 million dollars, suggesting routine consolidation rather than widespread selling pressure.
Rising Institutional Demand and ETF Developments
A significant catalyst this month has been BlackRock’s introduction of the iShares Staked Ethereum Trust (ETHB) on Nasdaq. This product differentiates itself from existing spot ETH offerings by incorporating staking rewards directly into the fund structure, appealing to institutions seeking both price exposure and yield generation from Ethereum’s proof-of-stake mechanism.
 Crypto ETF Flows — Bitcoin News
 $BTC: 7D streak | $1.16B total | $199M daily $ETH: 6D streak | $138M inflow | $13.75B AUM $SOL +$17.8M | XRP +$4.6MBlackRock IBIT, ETHA lead flows#CryptoSignals #ETFTrading pic.twitter.com/icb14JeOjN
— Boominance (@boominance) March 18, 2026
Ethereum-focused ETFs have demonstrated consistent capital inflows. During one notable trading session, net inflows reached approximately 12.6 million dollars, with a leading product accounting for over 10 million dollars alone. Throughout a six-day window in March, cumulative inflows into spot Ethereum ETFs approached 385 million dollars.
These persistent inflows have provided price support during moments of profit-taking and speculative unwinding.
Chart Analysis and Price Structure
From a technical perspective, ETH maintains its position above the 50-day moving average at $2,100.87. This moving average has acted as a reliable support zone during recent corrections.
My opinion on #Ethereum is the same.
We won't see 1500 until we see 2900.
3350$ 
1850$
2950$
1500$
6100$ (September – December) #ETH $ETH pic.twitter.com/kYBBfUS7Ql
— Celal Kucuker (@CelalKucuker) March 18, 2026
The 200-day moving average, positioned at $3,204.32, remains considerably above current trading levels, indicating that the broader uptrend has not yet been reestablished.
Critical support zones are identified at $2,000–$2,060. A breach below this area would likely test the $1,800 level, which has marked the lower boundary of the established range. Resistance is concentrated between $2,235 and $2,380, with $2,500 representing a significant breakout threshold that could trigger accelerated upside movement.
Ethereum derivatives activity has intensified notably, with open interest expanding by roughly 8–9% in a single 24-hour window, pushing the total above $30 billion across major exchanges including Binance, Bybit, and OKX. Market analysts observe that increasing open interest concurrent with price appreciation can amplify volatility in either direction.
Ethereum has repeatedly encountered difficulty establishing sustained trading above the $2,300–$2,400 corridor. The current price pattern reflects consolidation, characterized by compressed candle ranges and diminished realized volatility, often precursors to a significant directional breakout.
Ethereum’s total market capitalization currently stands at approximately $260.76 billion, maintaining its position as the second-largest cryptocurrency by market value.
The post Ethereum (ETH) Price Analysis: Can $385M ETF Inflows Spark a Major Rally? appeared first on Blockonomi.


 English (US) ·