
 2 hours ago
4
2 hours ago
4
Crypto derivatives are contracts that let traders bet on price moves without owning the coin. They include futures, perpetual futures and options. In the first half of 2026, these markets handled tens of trillions of dollars in trades.
This article gathers the main numbers from the first six months of the year. It draws on reports from CoinGlass, OneBullEx and MetaMask. The data covers trading volume, open interest, liquidations, exchange share, fund flows and the rise of decentralized platforms.
Unless noted, figures come from CoinGlass and cover January 1 through June 30, 2026. Where the other sources add a later date or a different count, the text says so.
| Total derivatives volume | $35.08 trillion |
| Average daily volume | $193.8 billion |
| Change in volume vs H1 2025 | -15.7% |
| Average daily open interest | $112.7 billion |
| Open interest on June 30 | $99.94 billion |
| Total liquidations | $73.35 billion |
| Long share of liquidations | 62.2% |
| Top 10 exchange share of volume | 81.2% |
Crypto Derivatives Trading Volume in H1 2026
Total derivatives volume reached $35.08 trillion in the first half of 2026. That works out to about $193.8 billion a day. In the same period of 2025, volume was $41.60 trillion, so the 2026 total is 15.7% lower.
CoinGlass says the drop points to weaker contract turnover and less short-term trading. It does not mean the market took on 15.7% less risk. As the next section shows, open interest fell by much less than volume.
The month-by-month path shows a steady cooling. January was the busiest month at $6.73 trillion. Volume slid to $6.25 trillion in February and $5.83 trillion in March.
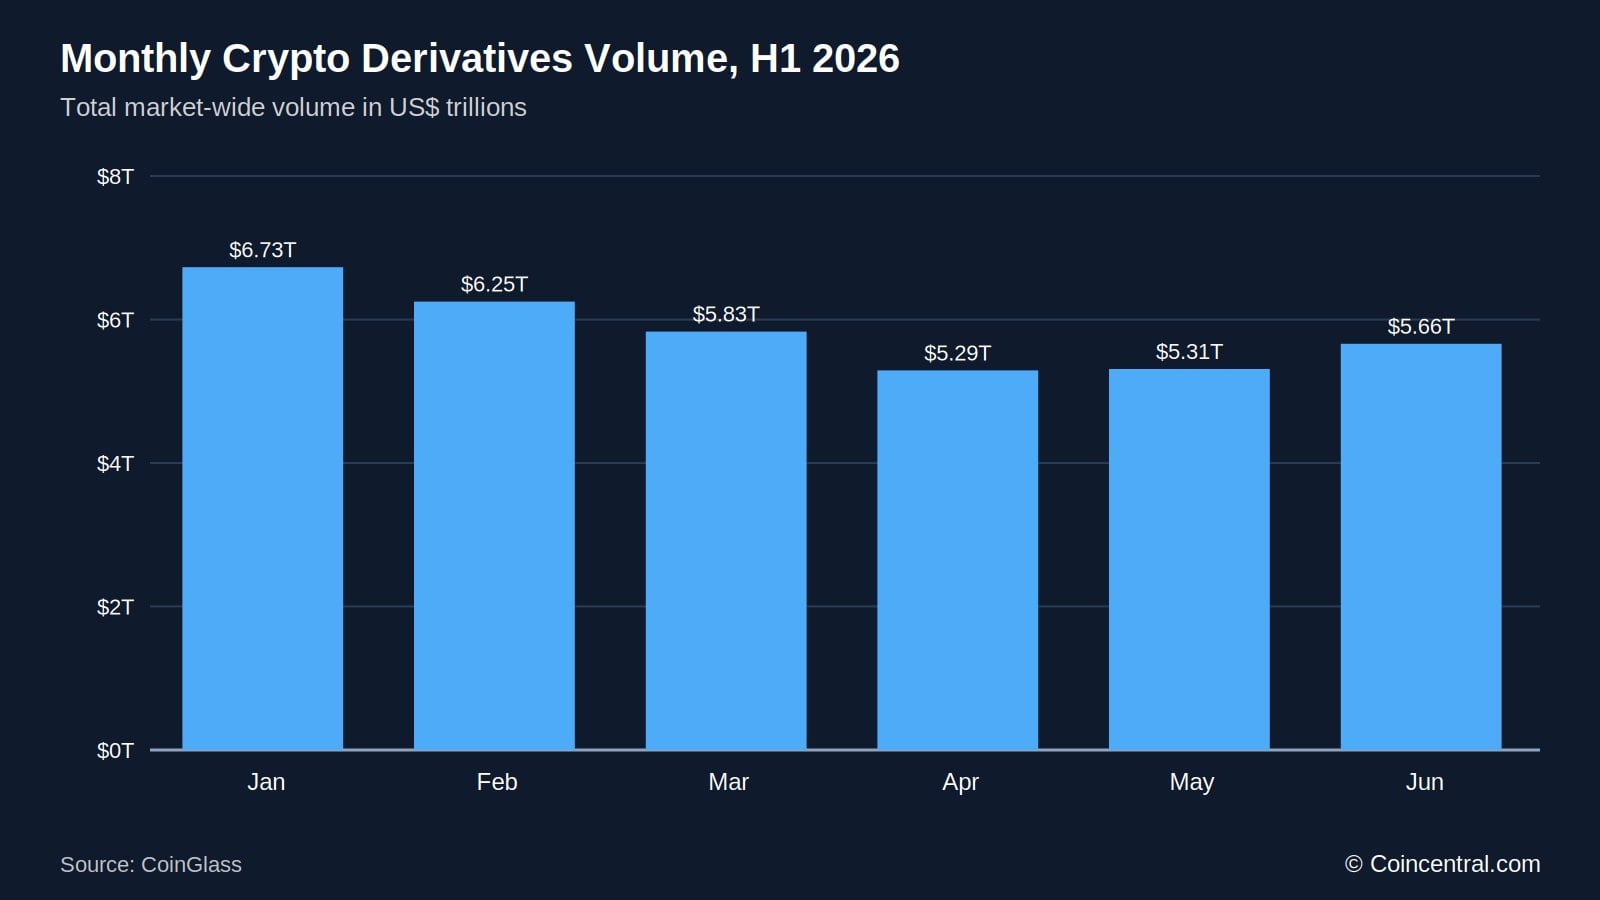 Figure 1: Monthly crypto derivatives volume, H1 2026. Source: CoinGlass.
April was the low point at $5.29 trillion. May was nearly flat at $5.31 trillion, and June rose to $5.66 trillion. That is a 6.5% gain over May, but June was still 15.9% below January.
The quarterly view tells the same story. Q1 volume was $18.81 trillion and Q2 volume was $16.27 trillion, a drop of 13.5%.
| Q1 2026 | $18.81 trillion |
| Q2 2026 | $16.27 trillion |
| H1 2026 | $35.08 trillion |
| H1 2025 | $41.60 trillion |
Daily volume swung widely. The H1 peak was $480.4 billion on February 6, and the low was $74.7 billion on April 5. That is a gap of about 6.4 times.
CoinGlass reads this as a sign that money gathered in a few volatile windows. On calmer days, participation was lighter. A rebound built on a handful of busy days does not yet prove a broad recovery.
MetaMask’s 2026 guide rounds the same data to about $35 trillion for the half and roughly $194 billion a day. It also reports that CME Group’s crypto futures and options averaged about 280,000 contracts a day in 2026, up 44% from a year earlier.
Open Interest Statistics
Open interest is the total value of contracts that are still open. It shows how much risk is sitting in the market at a given time. Average daily open interest was $112.7 billion in H1, down 10.0% from a year earlier.
That decline is smaller than the 15.7% drop in volume. CoinGlass measures the gap with a turnover ratio, which is average daily volume divided by average daily open interest. The ratio fell about 6.3% year over year, which means less trading per dollar of open positions.
In plain terms, traders traded less, but many kept their positions open. The risk did not leave as fast as the activity did.
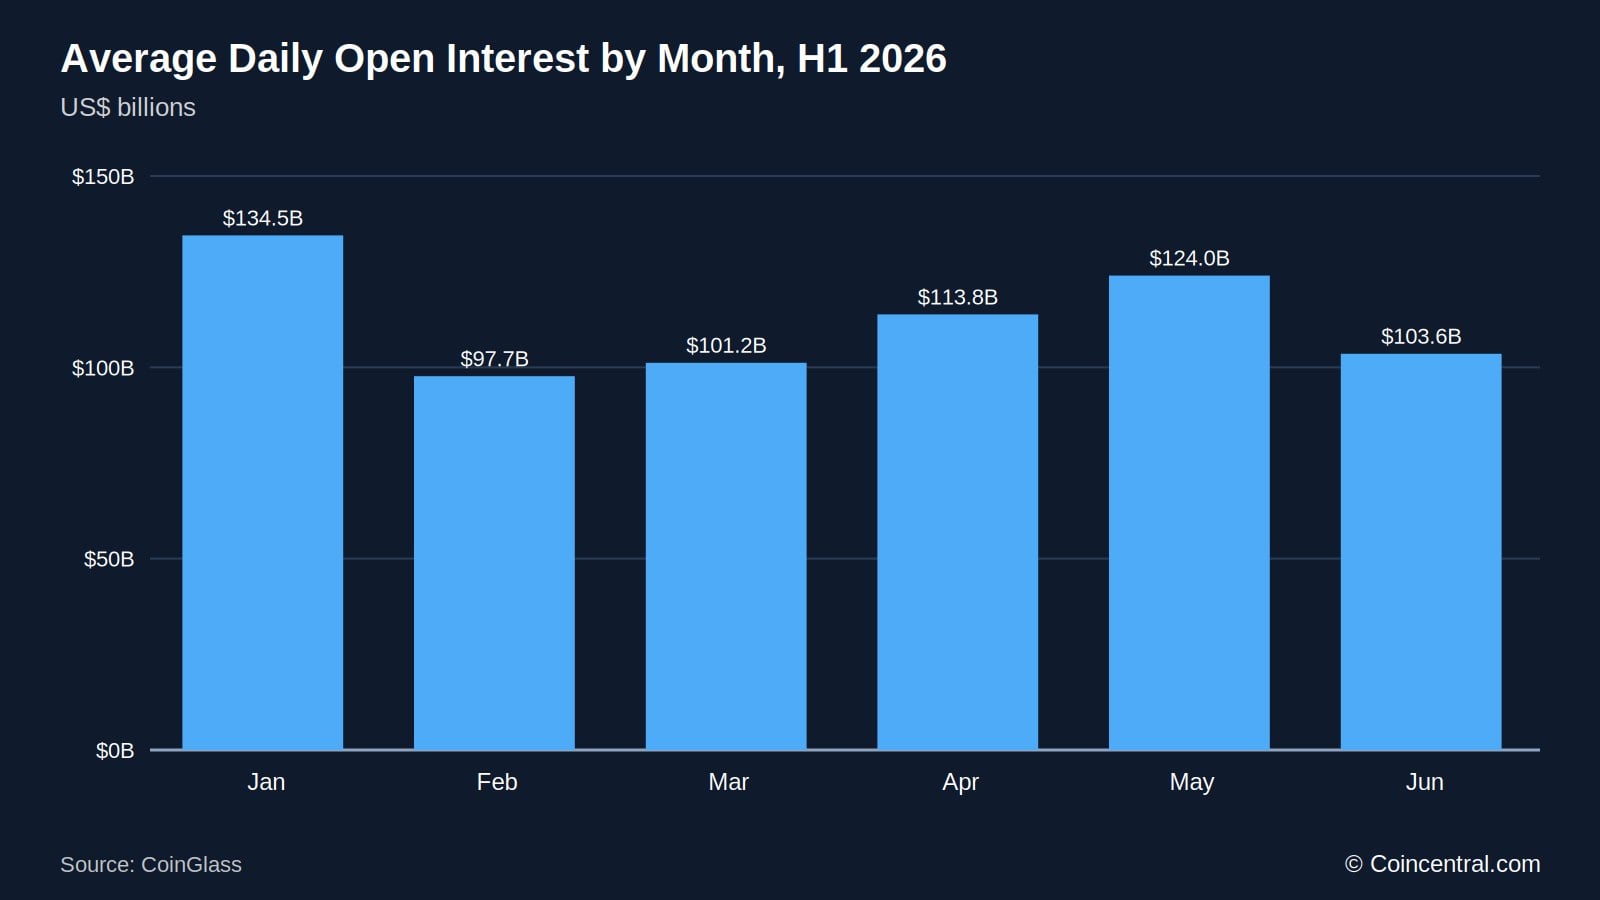 Figure 2: Average daily open interest by month, H1 2026. Source: CoinGlass.
Monthly averages moved in a wide range. Open interest averaged $134.46 billion in January, then fell 27.3% to $97.70 billion in February. It climbed to $123.99 billion in May before dropping to $103.56 billion in June.
| Daily peak (January 15) | $145.24 billion |
| Daily low (February 25) | $92.29 billion |
| H1 average | $112.7 billion |
| End of period (June 30) | $99.94 billion |
From the January peak to the February low, open interest fell 36.5% in six weeks. By June 30 it stood 17.9% below the start of the year. The spring recovery did not last to the end of June.
Average daily open interest in Q2 was 2.1% higher than in Q1, even though volume fell 13.5% over the same span. This is another sign that positions stayed in place while trading slowed.
A separate report from OneBullEx said aggregate open interest hit a record $120 billion in February 2026. It compared that to a prior peak near $100 billion in November 2021, which put the new level about 20% higher.
That figure does not match the CoinGlass numbers, which show a January peak of $145.24 billion and a February average of $97.70 billion. Providers count different exchanges and contract types, so totals vary. It is best to compare numbers from one source at a time.
OneBullEx also reported that perpetual futures made up the largest share of open interest. Binance and Bybit together held more than half of perpetual open interest, according to figures compiled in February. Options and dated futures grew more slowly.
Funding rates were positive in February, which means traders holding long positions paid those holding shorts. Funding is usually settled every eight hours. Positive funding can point to crowded long bets, though OneBullEx notes that crowding is not a timing signal.
The report also says part of the record came from higher coin prices, not only new leverage. As a share of total crypto market value, open interest stayed below the 2021 extremes. Analysts were split on whether the level was a warning sign.
MetaMask cites VanEck data showing bitcoin futures open interest dropped from about $61 billion to about $49 billion after a February price dip. By late April it had recovered. Funding rates stayed negative even as the price rose 14%.
Liquidation Statistics
A liquidation happens when an exchange closes a leveraged position because the trader’s margin runs too low. CoinGlass tracked these events across a sample of exchanges. Total liquidations reached $73.35 billion in H1, or about $405 million a day.
Long positions took most of the losses. Long liquidations totaled $45.63 billion, or 62.2%. Short liquidations totaled $27.72 billion, or 37.8%.
Longs are forced out when prices fall. The skew suggests that most deleveraging came during price drops.
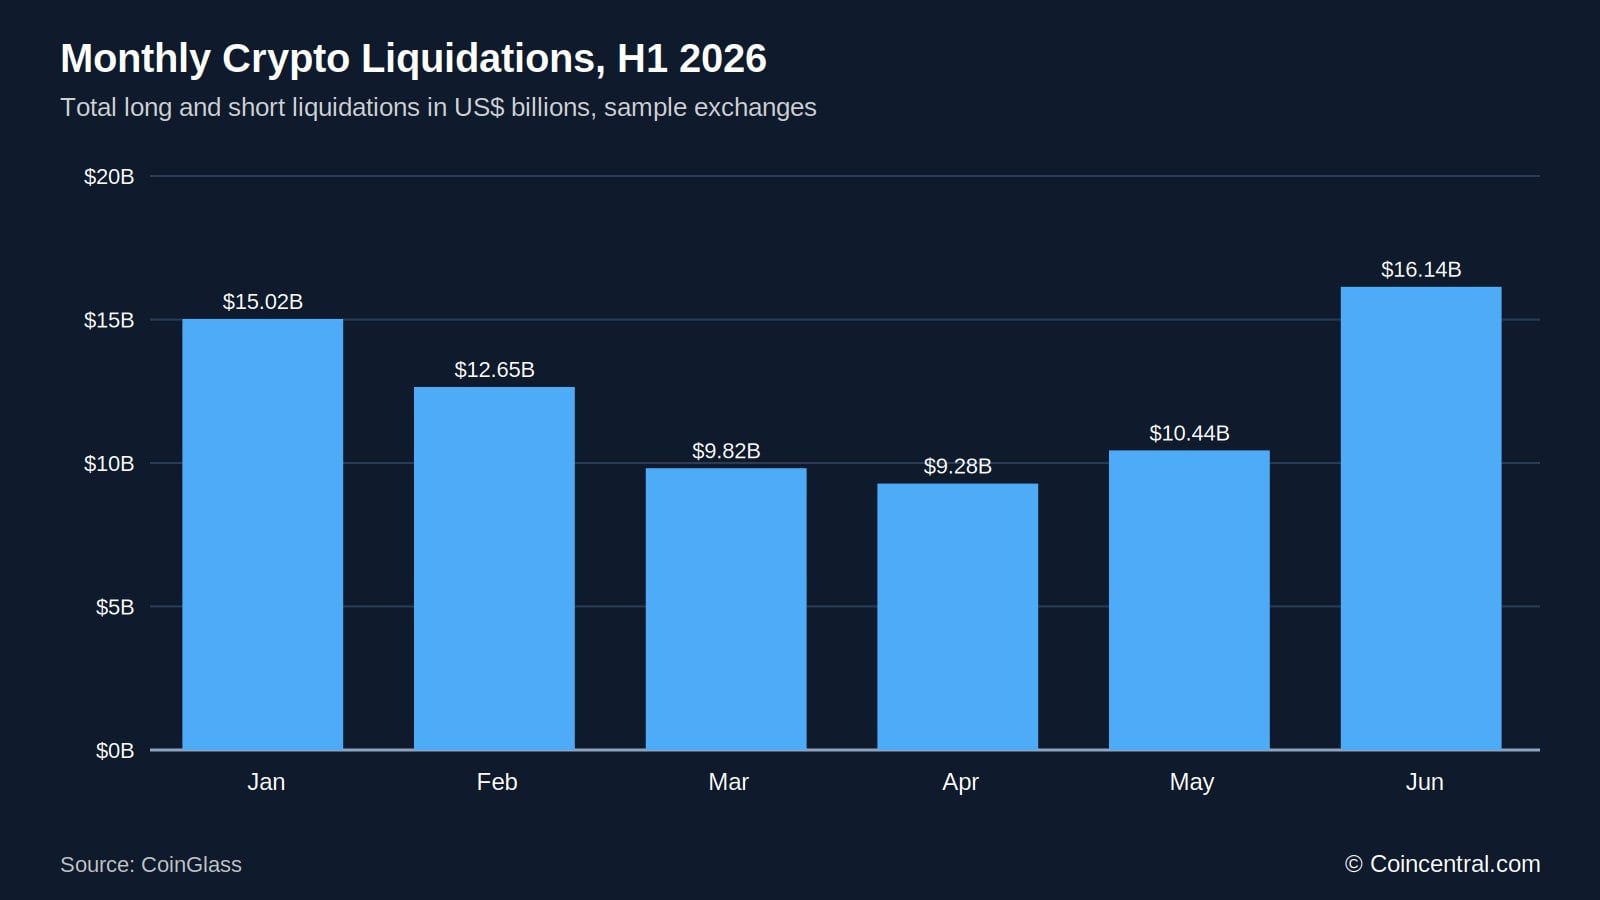 Figure 3: Monthly crypto liquidations, H1 2026. Source: CoinGlass.
Monthly totals fell from $15.02 billion in January to $9.28 billion in April. They then rose to $10.44 billion in May and $16.14 billion in June. June was the highest month of the half, and the long share that month rose to 69.5%.
Liquidations did not follow trading volume. June volume rose only 6.5% from May, while liquidations jumped about 55%. CoinGlass says position structure and price shocks drove the losses more than turnover did.
A few days made up a large part of the total. The three largest days are shown below. Together they account for 8.9% of all H1 liquidations.
| January 31 | $2.588 billion | $2.433 billion were longs |
| February 5 | $2.135 billion | Second-largest day |
| June 5 | $1.833 billion | Third-largest day |
MetaMask adds one more data point. About $1.26 billion in leveraged crypto positions was liquidated in a single 24-hour stretch on June 25, as bitcoin fell to its lowest level of the year. That count comes from a different tally than the CoinGlass daily list.
The lesson from the data is that lower trading volume did not make leveraged positions safer. Stress showed up in short bursts when prices moved fast.
Exchange Market Share Statistics
A small group of exchanges handles most derivatives trading. The Top 5 venues held 61.2% of H1 volume, and the Top 10 held 81.2%. Venues outside the Top 10 shared the remaining 18.8%.
Binance ranked first with $9.34 trillion, a 26.6% share. OKX was second with $4.19 trillion, or 11.9%. Together the two held 38.6% of the market.
| 1 | Binance | $9.34 trillion | 26.6% |
| 2 | OKX | $4.19 trillion | 11.9% |
| 3 | Bybit | $2.72 trillion | 7.7% |
| 4 | MEXC | $2.70 trillion | 7.7% |
| 5 | Gate | $2.53 trillion | 7.2% |
| 6 | Bitget | $1.68 trillion | 4.8% |
| 7 | CME | $1.43 trillion | 4.1% |
| 8 to 10 | Coinbase, BingX, WhiteBIT | $1.29 to $1.31 trillion each | About 3.7% each |
| 11 | LBank | $1.25 trillion | 3.6% |
Open interest tells a different story. Binance led again with $24.01 billion in average daily open interest, a 21.3% share. CME came second with $13.55 billion, or 12.0%.
CME held 4.1% of volume but 12.0% of open interest, about three times as much. CoinGlass links this to institutional hedging, basis trades and longer holding periods. Even so, CME’s monthly open interest share slipped from 13.7% in January to 9.3% in June.
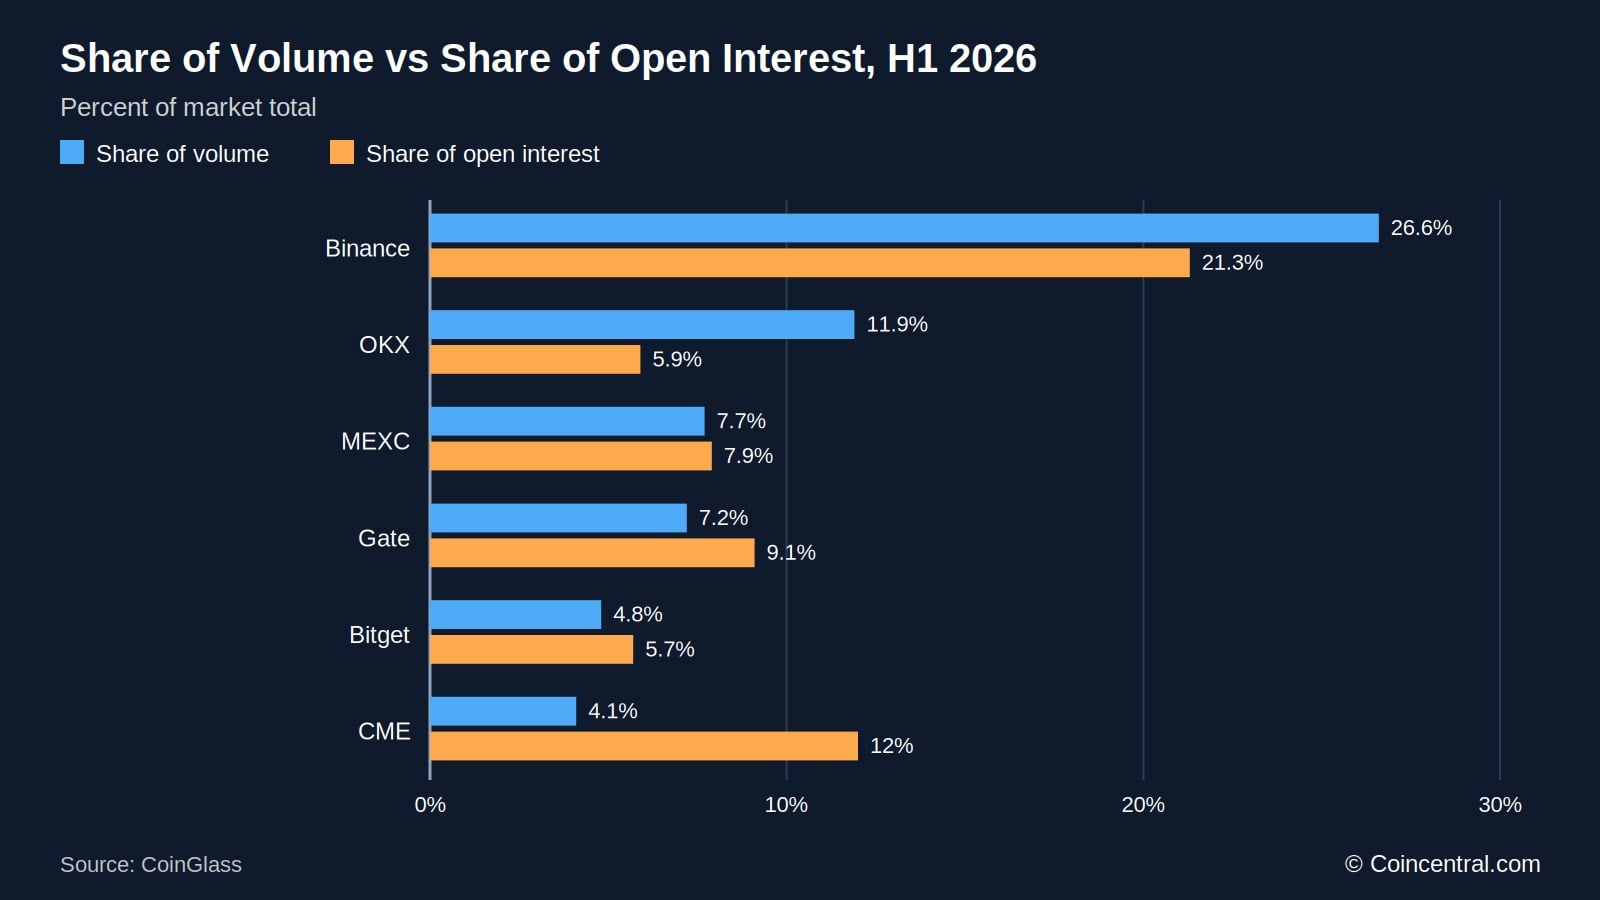 Figure 4: Share of volume compared with share of open interest for selected exchanges, H1 2026. Source: CoinGlass.
Binance’s volume share was larger than its open interest share, which points to faster turnover. Gate showed the opposite pattern, with 7.2% of volume and 9.1% of open interest. Crypto-native platforms dominate trading flows, while CME holds a bigger weight in standing positions.
Concentration grew during the half. The fixed Top 10 group rose from 79.7% of monthly volume in January to 82.3% in June. Binance moved from 24.1% to 28.3% and OKX from 10.6% to 12.8%.
Order book depth is even more concentrated. Within 1% of the mid-price, Binance and OKX held 64.8% of BTC depth. ETH depth was spread more evenly across venues.
| Binance | $236 million (44.0%) | $109 million (28.7%) |
| OKX | $112 million (20.8%) | $73.35 million (19.2%) |
| Bybit | $74.36 million (13.9%) | $62.61 million (16.4%) |
| Bitget | $71.70 million (13.4%) | $81.37 million (21.4%) |
| Gate | $42.64 million (7.9%) | $54.35 million (14.3%) |
| Five-venue total | About $537 million | About $381 million |
Proof of reserves data shows the same pattern. Sixteen sample exchanges reported about $233.34 billion in average daily user assets. Binance alone accounted for $150.21 billion, or 64.4%.
ETF Flows and Strategy Holdings
Institutional money moved in different directions in H1. U.S. spot bitcoin ETFs recorded net outflows of $5.460 billion. Days with inflows added $13.170 billion, but days with outflows removed $18.630 billion.
Monthly flows swung back and forth. January and February saw outflows. March and April brought inflows of $1.322 billion and $1.966 billion, but May and June reversed with outflows of $2.425 billion and $4.510 billion.
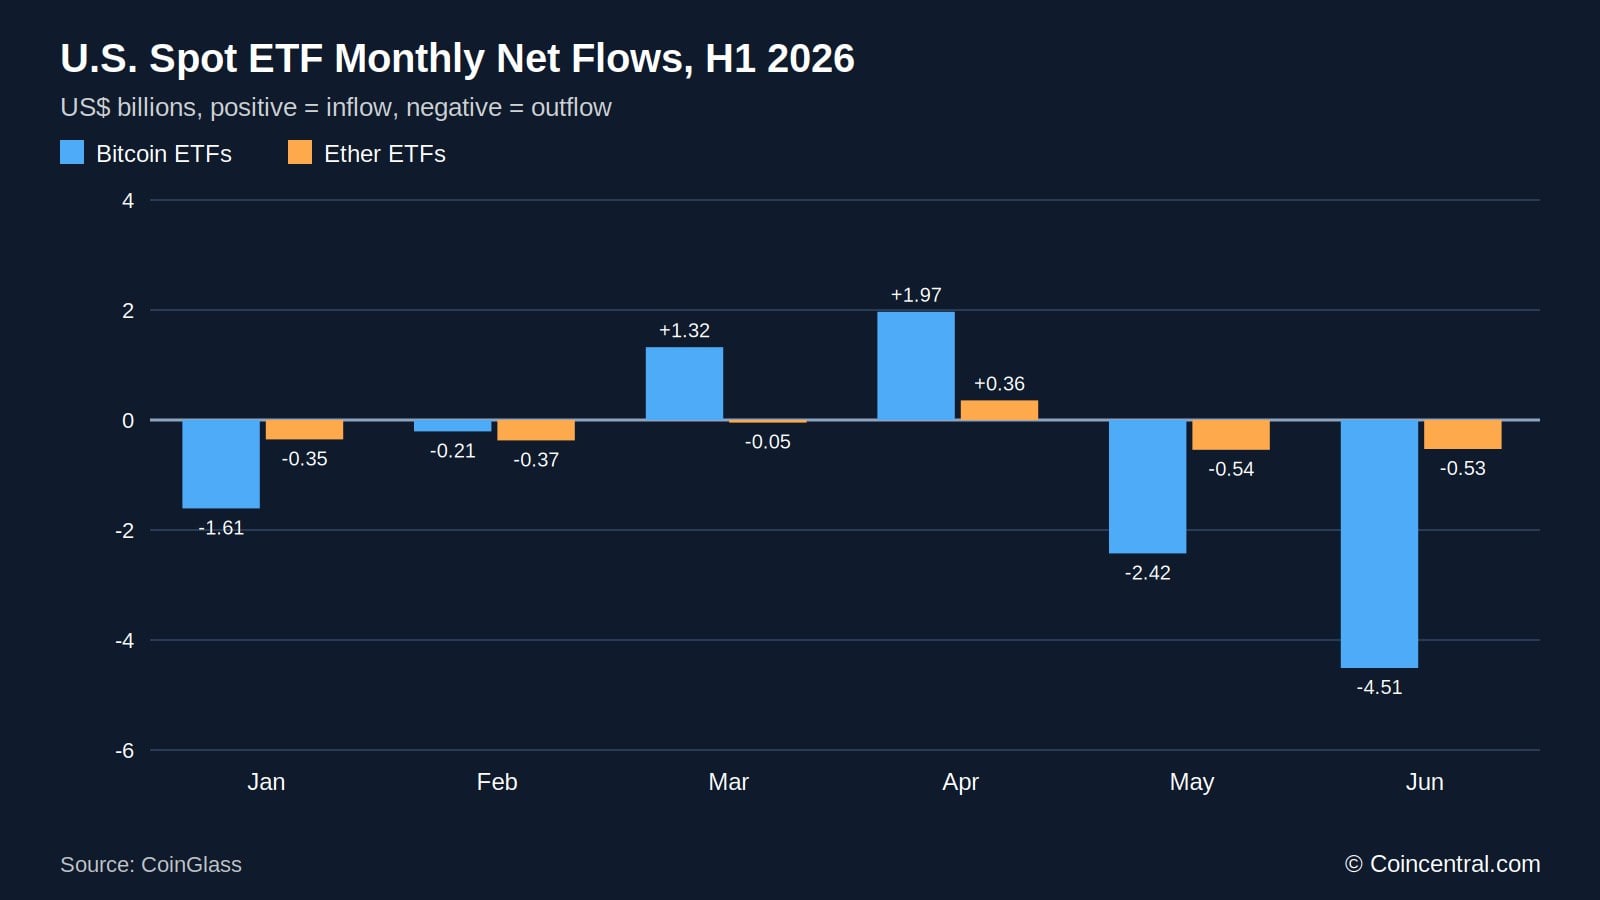 Figure 5: U.S. spot Bitcoin and Ether ETF monthly net flows, H1 2026. Source: CoinGlass.
Ether ETFs lost $1.483 billion on a net basis, with $3.215 billion in inflows and $4.698 billion in outflows. April was the only positive month, at $356 million. Total assets in ether ETFs fell from $19.05 billion on January 2 to $8.33 billion on June 30.
CoinGlass notes that the asset drop reflects both redemptions and price moves, so outflows do not explain all of it. Ether ETF outflows were smaller than bitcoin ETF outflows in dollars, but the asset base was smaller too.
| January | -$1.606 billion | -$353 million |
| February | -$207 million | -$370 million |
| March | +$1.322 billion | -$46 million |
| April | +$1.966 billion | +$356 million |
| May | -$2.425 billion | -$541 million |
| June | -$4.510 billion | -$529 million |
| H1 total | -$5.460 billion | -$1.483 billion |
Demand later picked up. MetaMask reports that U.S. spot bitcoin ETFs took in more than $2.2 billion from September 21 to 24, after a choppy summer that included about two months of outflows.
Corporate buyers behaved differently from ETF holders. Strategy held 672,500 BTC at the start of the year and 846,000 BTC on June 30. That is a net gain of 173,500 BTC, or 25.8%.
| January | 40,147 |
| February | 5,075 |
| March | 44,377 |
| April | 56,235 |
| May | 25,404 |
| June | 2,262 |
| H1 total | 173,500 |
March and April together made up 58.0% of the half’s net additions. The pace slowed sharply in June. The company also sold BTC for the first time in this period.
Strategy sold 32 BTC in late May, raising about $2.5 million for preferred-stock payments. It sold another 1,363 BTC on June 29 and 30, raising $80.8 million for those payments and its U.S. dollar reserve. Together the sales were about 0.16% of holdings.
On June 29 the company also announced a plan that allows BTC sales of up to $1.25 billion under set conditions. It is not a promise to sell. MSTR shares rose 4.9% on the day of the announcement.
MetaMask reports that publicly traded companies held about 1,272,886 BTC, worth about $106 billion, as of September 2026.
TradFi Perpetual Contract Volume
Perpetual contracts are no longer limited to crypto assets. Exchanges now list them on stocks, ETFs, stock indices, commodities and currencies. CoinGlass tracked this group, called TradFi contracts, across five sample exchanges.
H1 volume came to about $1.20 trillion. The figure leaves out spot trading and spot trades of tokenized stocks. CoinGlass adds that growth was also affected by wider disclosure coverage.
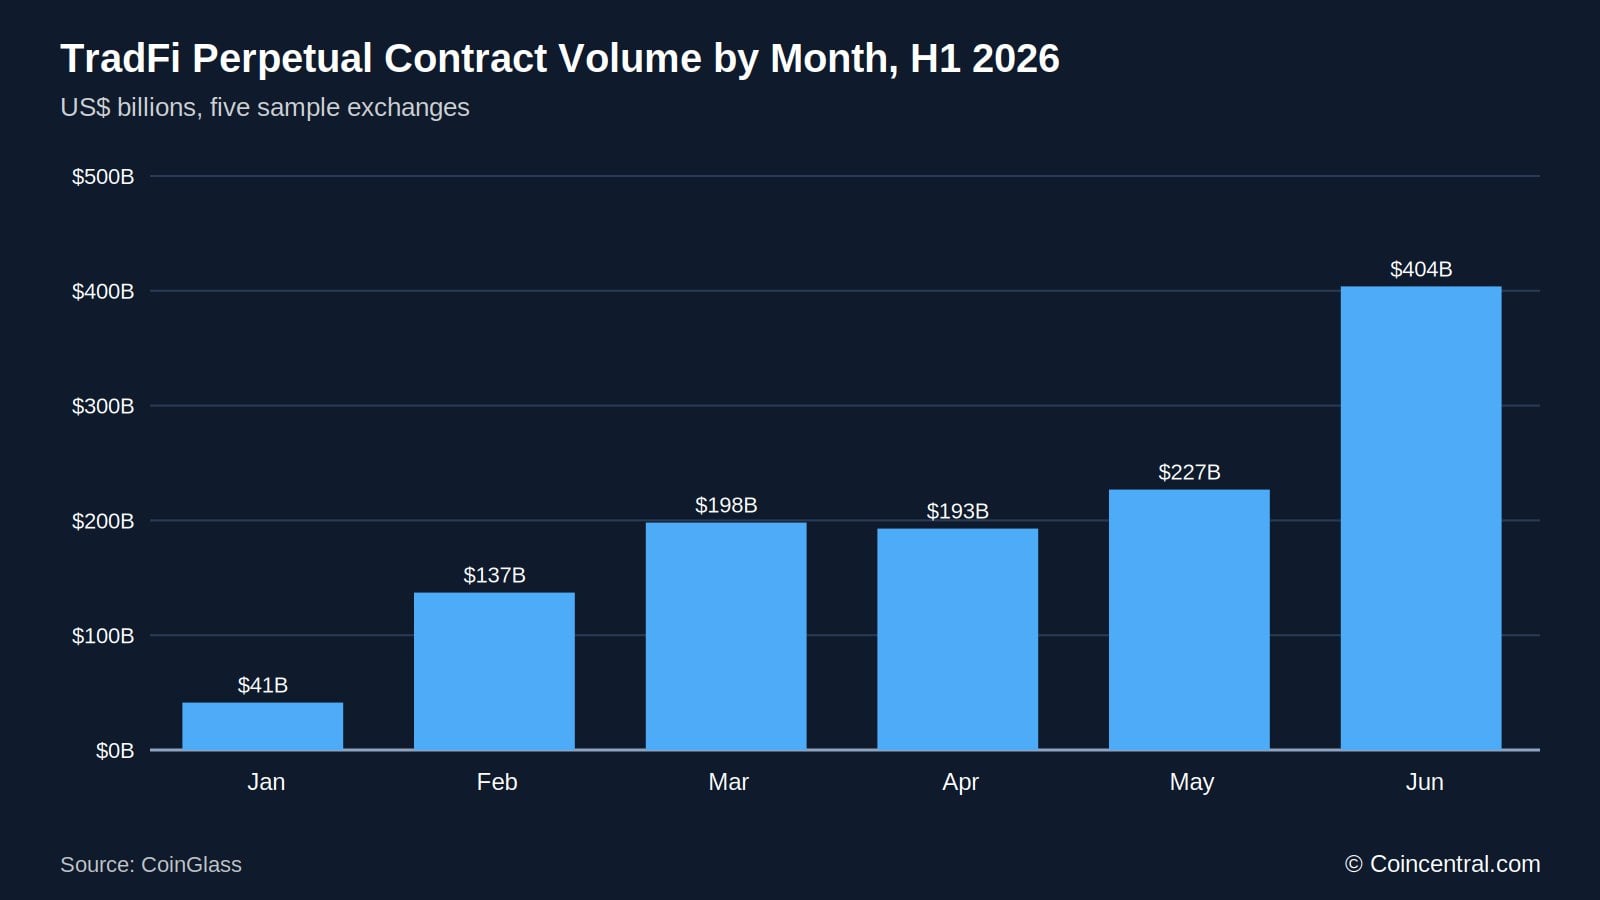 Figure 6: Monthly TradFi perpetual contract volume, H1 2026. Source: CoinGlass.
Volume grew almost every month. It rose from $41.31 billion in January to $198.15 billion in March, then hit $226.77 billion in May. June reached $403.85 billion, or 33.7% of the half’s total.
A few platforms dominate this niche. Binance recorded $666.34 billion, or 55.5%. tradeXYZ followed with $291.19 billion, or 24.3%.
| Binance | $666.34 billion | 55.5% |
| tradeXYZ | $291.19 billion | 24.3% |
| OKX | $117.66 billion | 9.8% |
| Bitget | $66.41 billion | 5.5% |
| Gate | $58.47 billion | 4.9% |
The top three platforms held 89.6% of the total. For now, growth in TradFi perpetuals is led by a small number of venues.
Perpetual Futures, DEXs and Regulation
There are three main ways to trade bitcoin price moves. Spot trading means owning the coin. Standard futures expire on a set date, while perpetual futures never expire and use a funding rate to stay close to the spot price.
| Expiry | Fixed, monthly or quarterly | None | Not applicable |
| Leverage | Yes | Yes | No |
| Owns the BTC | No | No | Yes |
| Funding cost | None, cost is in the basis | Periodic payments | None |
| Typical venue | CME | Binance, Bybit, Coinbase Derivatives | Coinbase, Kraken, Gemini |
Perpetuals are the most traded form by volume, according to MetaMask. A growing share of that trading now happens onchain. The top 12 decentralized perpetual exchanges handled about $628 billion in 30-day volume as of September 2026.
DEXs held roughly 10% of perpetual futures volume in April 2026. Hyperliquid, a network built for derivatives, recorded about $2.9 trillion in volume in 2025. Its 30-day volume in September 2026 was about $218 billion, or around 35% of onchain perpetual volume.
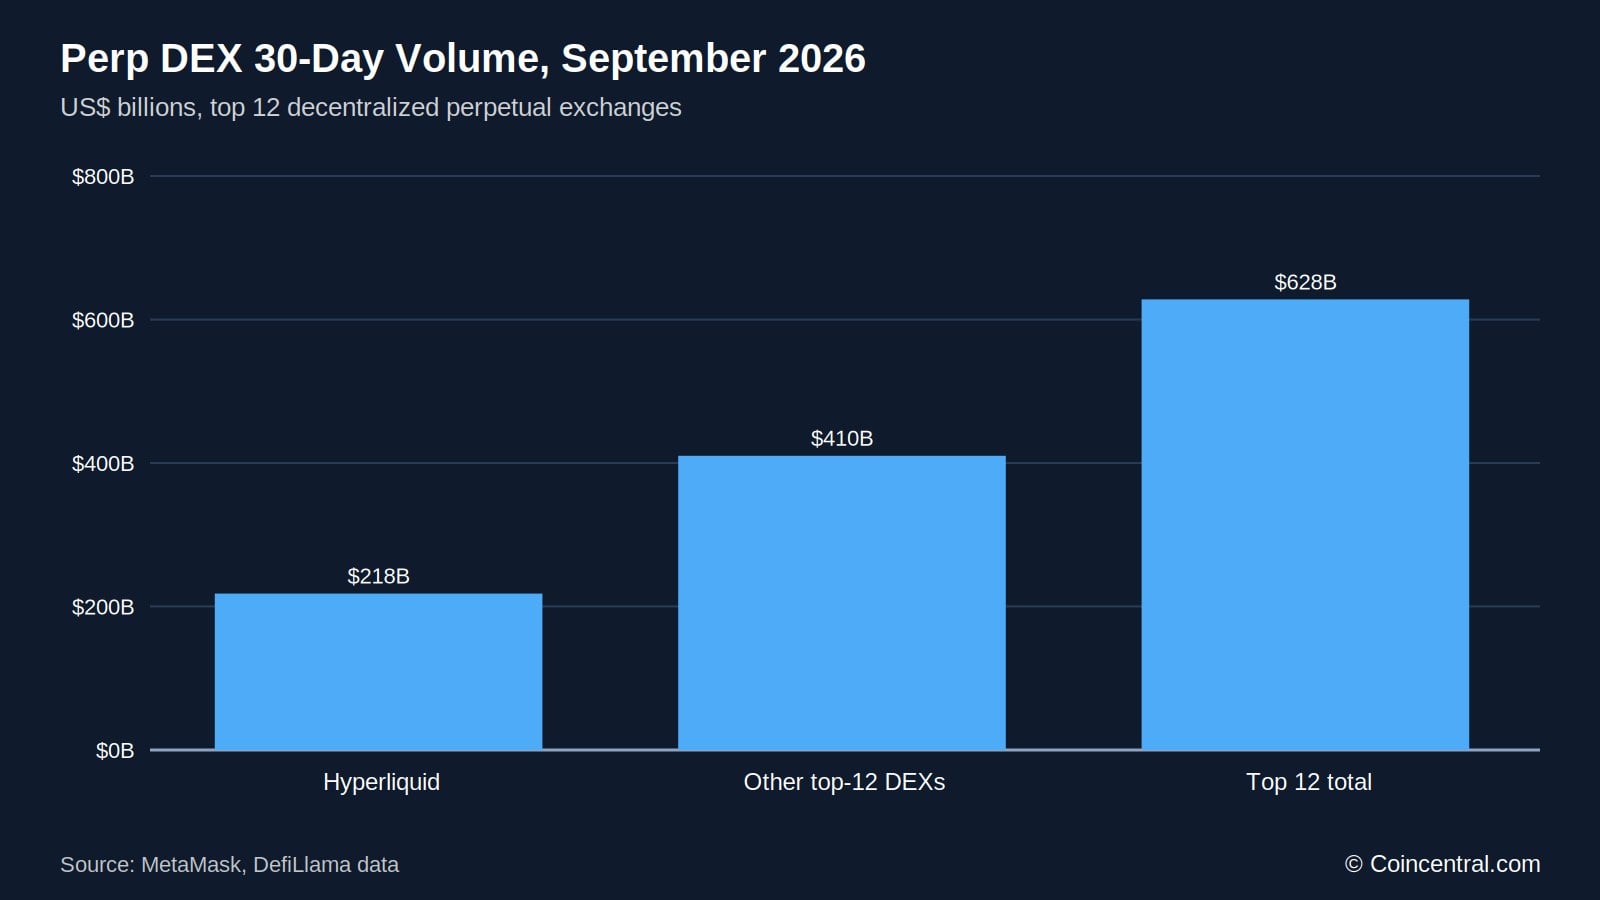 Figure 7: Perp DEX 30-day volume, September 2026. Source: MetaMask, citing DefiLlama.
Onchain perpetual open interest stood near $14.6 billion in September, led by Hyperliquid. These platforms also list contracts on gold, silver, currency pairs and tokenized equity indices.
Rules differ by region. In the U.S., the Commodity Futures Trading Commission treats bitcoin as a commodity. Futures exchanges must register as designated contract markets, which brings segregated client funds and market surveillance.
MetaMask notes that offshore venues often have little or no oversight and may restrict U.S. residents. In March 2026, the SEC issued an interpretation, joined by the CFTC, on how federal securities laws apply to crypto assets.
CME moved its regulated crypto futures and options to 24/7 trading on May 29, 2026. This removed the weekend price gaps that used to show up on Monday charts. CME’s crypto futures averaged a record $12 billion in daily notional volume in 2025, up 139% from 2024.
Key Takeaways and What to Watch
The first half of 2026 was not a simple story of falling leverage. Trading cooled, but open positions fell more slowly, and losses came in short bursts. Volume was down 15.7%, average open interest was down 10.0%, and total liquidations reached $73.35 billion.
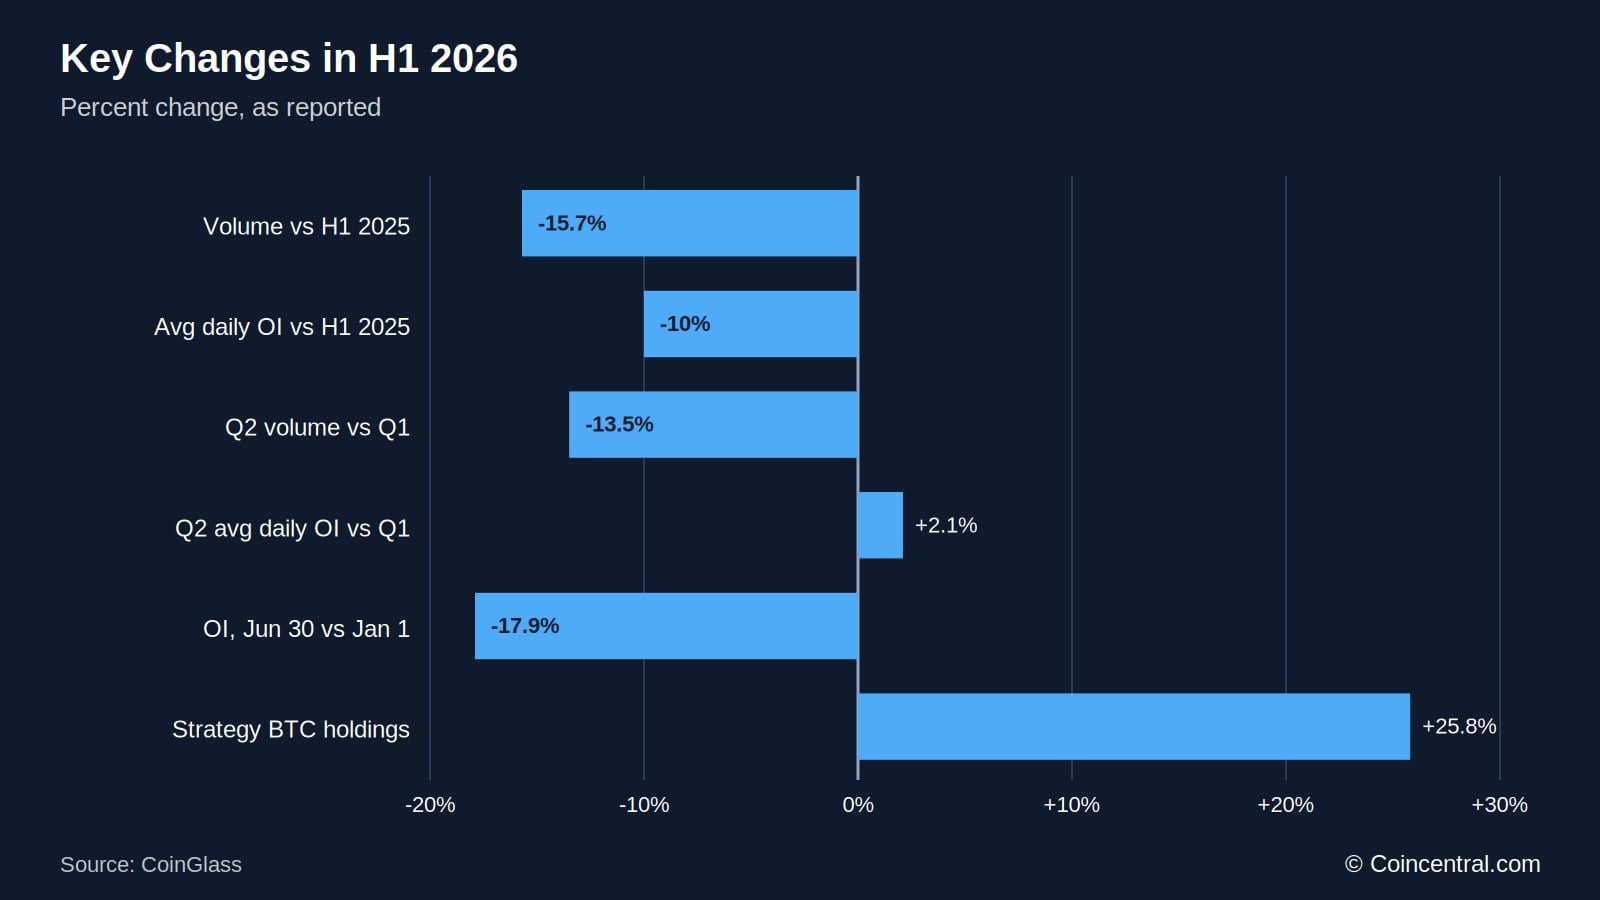 Figure 8: Key changes in H1 2026 as reported by CoinGlass.
Market structure stayed concentrated. The Top 10 exchanges held 81.2% of volume and 79.3% of open interest. Two venues held 64.8% of BTC order book depth.
Institutional demand split. ETFs saw net outflows in both bitcoin and ether, while Strategy added 173,500 BTC but began selling small amounts. CME kept a large weight in open positions.
CoinGlass suggests watching whether volume keeps recovering and whether ETF flows and corporate buying improve together. Other items to follow include funding rate trends, open interest growth compared with price moves, and how often Strategy sells BTC.
This article is for information only and is not financial advice. Derivatives trading carries a high risk of loss.
Sources
- CoinGlass 2026 Semi-Annual Cryptocurrency Derivatives Market Report
- Crypto Derivatives Open Interest Hits Record $120 Billion In February 2026
- Bitcoin futures trading in 2026
The post Crypto Derivatives Statistics 2026: Volume, Open Interest and Liquidations appeared first on Blockonomi.






 English (US) ·