
TLDR:
- Cardano price trades near $0.82 while testing the 50-day moving average as a short-term resistance level.
- Analysts say a daily close above the 50-day MA could trigger upside momentum toward $0.90 and $1.00.
- Long-term chart analysis points to potential ADA targets above $10 if bullish wave structures hold.
- Trading volume cooled after a June spike, signaling consolidation before the next possible market move.
Cardano is hovering near a critical technical level, and traders are closely watching how the price reacts. The token has seen steady pressure around the 50-day moving average, often a turning point in market sentiment.
Momentum is building, with analysts debating whether ADA is preparing for a breakout. Some see the setup as a bullish trigger, while others warn of possible pullback if resistance holds. Either way, the next move could set the tone for coming weeks.
Cardano Price Testing 50-Day Moving Average
Crypto analyst Sssebi observed that ADA is “getting squeezed” into the 50-day moving average on the daily chart.
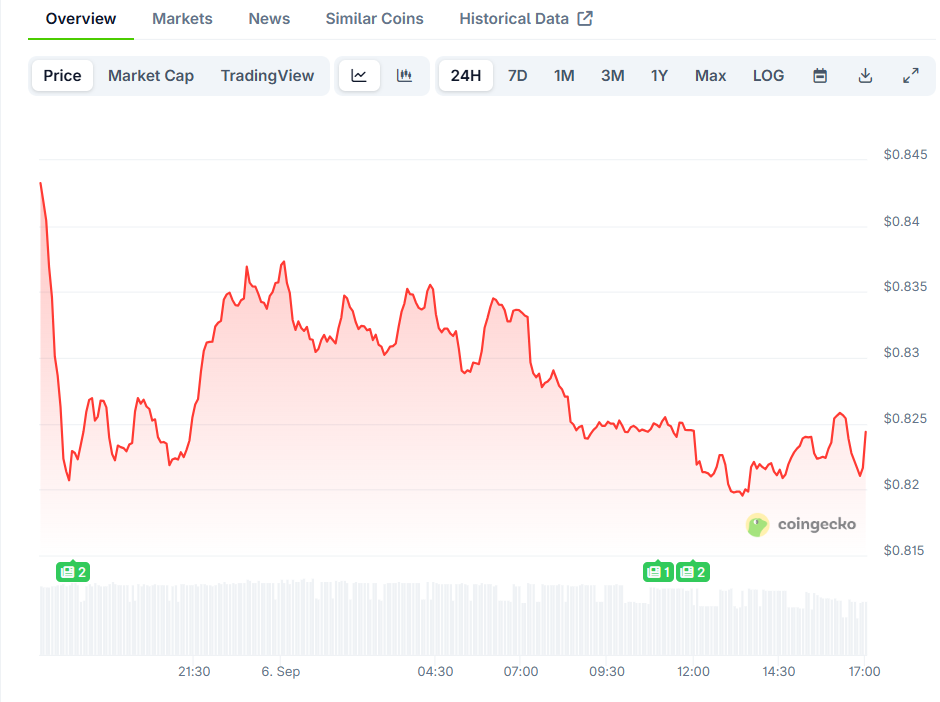 Cardano price on CoinGecko
The asset is currently trading near $0.8215, according to CoinGecko, after a 2.59% daily decline. Traders say a close above this level could send the token higher, with potential short-term targets of $0.90 and $1.00.
Recent chart data shows ADA forming higher lows since early 2023, pointing to an ongoing uptrend. The 50-day moving average now sits directly above price, acting as both resistance and a trigger point.
Market watchers argue that a confirmed break above this average often attracts fresh buyers. This is why many see the current squeeze as a deciding moment.
Volume has cooled slightly after an active June, which suggests consolidation. Analysts suggest this pause may be setting up the market for its next directional move. The Relative Strength Index remains around 50, leaving room for momentum to swing either way.
$ADA is getting squeezed into this 50day MA.
A close above it could really send $ADA flying.🚀 https://t.co/axGPK6X1vW pic.twitter.com/yEE3e8fn2t
— Sssebi🦁 (@Av_Sebastian) September 6, 2025
Long-Term ADA Price Outlook
Another trader known as The Penguin shared a broader view, describing ADA’s chart as one of the strongest high-timeframe setups.
He pointed to a completed correction and outlined a wave structure that could support targets above $10 over time. The analysis referenced multiple technical tools, including a 0.382 retracement and confluence zones, supporting the bullish scenario.
The idea is that if the low is already in place, ADA could be entering a new wave higher. That would align with longer-term investors seeking exposure around current levels. However, the analyst also cautioned that outcomes depend heavily on Bitcoin’s broader trend.
$ADA Macro Outlook
One of the best looking HTF charts imo – targets $10+ long-term.
– Clear impulsive structure up for a completed Wave 1 of a proposed Wave 3.
If this is the bottom, confluence is huge:
– ABC correction complete
– 1–1 extension + 0.382 retrace of the full move… pic.twitter.com/ybphd1K0Z8
— The Penguin (@ThePenguinXBT) September 6, 2025
For now, ADA trades below the 50-day moving average, with price direction undecided. Traders will watch closely for a decisive close above or rejection at this level. A move through resistance could build momentum, while failure could extend consolidation.


 English (US) ·