
TLDR
- Cardano price must break above $0.88 resistance to confirm a rally toward $1.20
- XRP functionality will be added to Cardano’s Lace wallet by end of 2025
- Current price facing strong resistance at $0.96 with support at $0.80
- Technical indicators suggest a potential 16-24% upside to $0.95-$1.02 range
- Mixed signals with overall bullish trend despite short-term bearish momentum
Cardano is showing promising signs of an impending breakout that could drive its price toward higher levels. Currently trading at $0.82, ADA sits at a critical juncture that could determine its short to medium-term trajectory.
Analyst Ali Martinez has emphasized that Cardano’s price must break the $0.88 resistance to confirm the next rally. With the price consolidating within a rising channel, a move above this level could release momentum toward the $1.20 target.
This potential breakout would validate Cardano’s bullish outlook in the short term. The price has been rising with solid support levels providing a foundation for the current movement.
If ADA holds above the $0.80 mark, it sets the stage for a further surge. However, if the $0.88 resistance level remains unbroken, long-term consolidation could result, keeping ADA in a sideways price action phase.
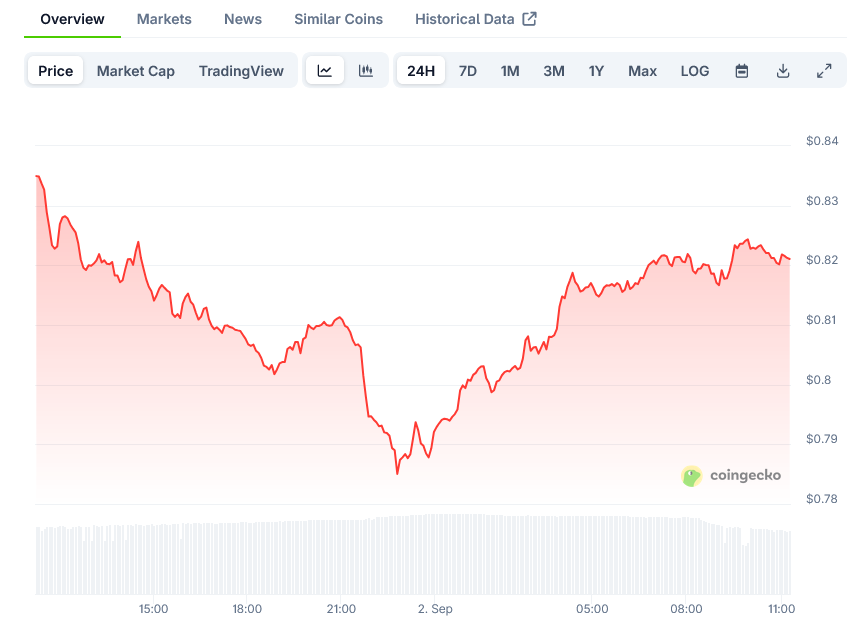 Cardano Price on CoinGecko
Technical analysis reveals a mixed but ultimately constructive picture. The RSI stands at 47.15, indicating neutral momentum and providing room for upward movement without being overbought.
The MACD histogram shows -0.0133, suggesting short-term bearish momentum that diverges from the overall bullish trend classification. This divergence often precedes trend continuation moves when price holds above key support levels.
Technical Resistance Levels
Cardano is experiencing strong resistance at $0.96. This price level has repeatedly capped bullish attempts, indicating possible sell-off pressure when approached.
When the price nears $0.96, selling pressure typically increases as traders take profits, potentially resulting in short-term pullbacks. Market forces at this resistance will play a key role in determining Cardano’s short-term trend.
Unless ADA breaks out above $0.96, the price will likely fall back to lower support levels at $0.88 or $0.82. Despite recent fluctuations, the token still trades above the $0.80 support, suggesting buyers are defending this level.
A bullish rebound could push Cardano back toward recent highs if momentum continues. For this to materialize, ADA needs to break above the 20-period Simple Moving Average at $0.88.
The 200-period SMA at $0.73 provides strong foundational support, sitting 12% below the current price and confirming the longer-term bullish structure.
XRP Integration with Cardano
In a development that could impact Cardano’s ecosystem, Charles Hoskinson announced that XRP functionality will be added to the Cardano Lace wallet by the end of 2025.
This announcement resulted from a meeting between Ripple CEO Brad Garlinghouse and Hoskinson, indicating that the two projects would work together in the future.
The integration of XRP in Cardano’s Lace wallet may increase the utility of both tokens. This strategic move could attract more institutional attention and help scale up Cardano’s ecosystem.
By endorsing XRP, Cardano may become more valuable and attractive to new market segments. Such a partnership could draw new investors and improve Cardano’s position in the blockchain space.
As utility increases, Cardano is consolidating its role as a versatile blockchain platform. This technical integration represents a practical advancement that could strengthen Cardano’s appeal beyond price considerations.
The primary ADA price target in a bullish scenario is the $0.95-$1.02 resistance zone, representing the convergence of the upper Bollinger Band ($0.97) and strong resistance at $1.02.
This represents a 16-24% upside potential from current levels within a timeframe of 2-4 weeks. The prediction carries medium confidence based on the overall bullish trend classification, despite short-term momentum concerns.
For traders asking whether to buy or sell ADA, the technical setup favors buyers willing to implement proper risk management. A stop-loss below $0.75 provides reasonable downside protection while maintaining exposure to the upside potential.
The timeline for this forecast extends through late September, with the first major test likely occurring at the $0.88 resistance level within the next 5-7 trading days.
Traders should prepare for potential volatility around these key technical levels as the market determines ADA’s next directional move.


 English (US) ·