
 1 hour ago
9
Brent crude climbed above $116 a barrel, its first trip to that level since April. Equities flinched, crypto followed, and traders were reminded that energy prices still have a vote in every asset class.
Oil is supposed to be a commodities story. Lately it keeps showing up uninvited in the crypto group chat.
The timing made things worse. Fresh University of Michigan data showed consumers still expect inflation of 5% over the next year, a reading that leaves little space for the rate cuts many investors have been hoping for.
The damage on the board
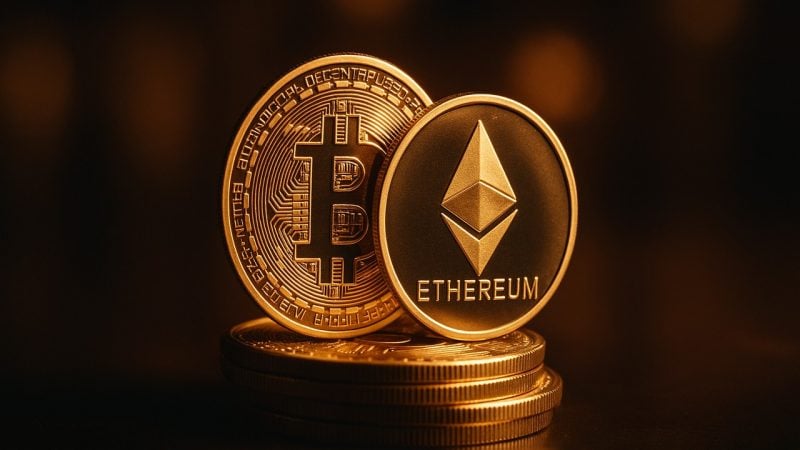
Bitcoin hovered near $81K, down 3.1% over 24 hours. On a seven-day basis, it was off a more modest 1.0%, which suggests most of the pain landed in a single session rather than in a slow bleed.
Ethereum traded around $2,400, matching Bitcoin’s 3.1% daily decline almost exactly. When the two largest crypto assets move in lockstep like that, it usually points to a macro driver, not a coin-specific problem.
Solana held at $104 after slipping 2.9% over the same window. XRP drifted lower to $1.31.
None of these moves qualify as a crash. Call it a collective, synchronized sigh.
Sentiment cooled along with prices. The Alternative.me Fear & Greed Index, which blends several market signals into a single 0 to 100 score, sat at 50, squarely in Neutral territory. A week earlier it read 63, firmly in Greed.
A 13-point slide in seven days is not panic. It is the market quietly taking its foot off the gas.
One corner of crypto ignored the mood entirely. Quantum-resistant tokens, projects built around cryptography designed to withstand future quantum computers, led all categories with a 51.8% gain over the past week.
That kind of rally in a niche sector, during a broader pullback, tends to reflect narrative-driven trading more than anything happening in the wider market. Investors chasing it should know the difference.
Why a barrel of oil matters to a Bitcoin chart
The connection between crude and crypto is not obvious at first glance. Think of it as a chain of dominoes rather than a direct line.
Oil feeds into the cost of nearly everything: shipping, manufacturing, heating, and the price at the gas pump. When it gets more expensive, those costs tend to spread through the economy and show up as higher inflation.
Higher inflation makes central banks reluctant to lower interest rates. And elevated rates make speculative assets, from growth stocks to crypto, less attractive compared with safer places to park cash.
Put more simply, pricey oil can keep borrowing costs high, and high borrowing costs drain the fuel that risk assets run on.
The University of Michigan figure adds another layer. Inflation expectations matter because they can become self-fulfilling. If households expect prices to keep rising, they may spend and negotiate wages accordingly, which can help keep inflation elevated.
A 5% one-year expectation, holding steady, gives policymakers little evidence that the inflation fight is winning. Pair that with oil above $116, and the case for near-term easing gets harder to make.
That is the backdrop crypto traders woke up to. Bitcoin has spent years being pitched as an inflation hedge, but in moments like this it has tended to trade more like a high-beta tech stock, reacting to rate expectations first and the inflation narrative second.
What to watch from here
The most immediate question is whether Brent can hold above $116. A one-day spike that fades would likely be shrugged off, while a sustained move higher would keep pressure on inflation forecasts and, by extension, on risk appetite.
For crypto investors, the seven-day numbers offer some perspective. Bitcoin’s 1.0% weekly decline is mild compared with its 3.1% daily drop, meaning the asset had been holding up reasonably well before oil grabbed the spotlight.
Whether that resilience returns depends heavily on the macro calendar. Any upcoming inflation data that confirms the University of Michigan reading could reinforce the risk-off tone. A softer print could just as easily give rate-cut hopes a second wind.
The Fear & Greed Index is worth tracking too. A drop from 63 to 50 shows enthusiasm has cooled without tipping into fear. If the index keeps sliding toward the 30s or 40s, it would signal that caution is hardening into something more defensive.
On the flip side, a neutral reading can also mean the market has not yet decided where it is headed. Traders who remember how quickly sentiment swung last week will know that neutral can flip in either direction fast.
The correlation between major tokens also bears watching. Bitcoin, Ethereum, and Solana all fell by roughly 3% in a single day, a sign that macro forces, not project fundamentals, are setting the pace right now.
When that happens, picking the strongest coin matters less than understanding the broader environment. Diversifying across large-cap tokens offers limited protection if everything is reacting to the same oil price and the same inflation data.
Meanwhile, the quantum-resistant rally is a reminder that pockets of speculation can thrive even when the overall market is cautious. Gains of 51.8% in a week are eye-catching. They also tend to attract latecomers right before momentum fades, so sector heat is not the same as sector strength.
For equity investors, the same logic applies. Energy costs that ripple into inflation expectations can weigh on valuations across growth-oriented sectors, which is why stocks and crypto flinched together on the oil move.
The broader takeaway for anyone holding risk assets is that the inflation story is not finished. Oil above $116 and inflation expectations stuck at 5% keep the Federal Reserve’s options narrow, and markets that had been leaning toward easier policy are being forced to recalibrate in real time.
Disclosure: This article was edited by Vivian Nguyen. For more information on how we create and review content, see our Editorial Policy.






 English (US) ·