
Bitcoin has returned toward $80K after another recovery failed to gain traction. With short-term trendline support already lost and large spot orders remaining prominent, the price faces an important test of demand beneath recent lows.
Bitcoin Price Analysis: The Daily Chart
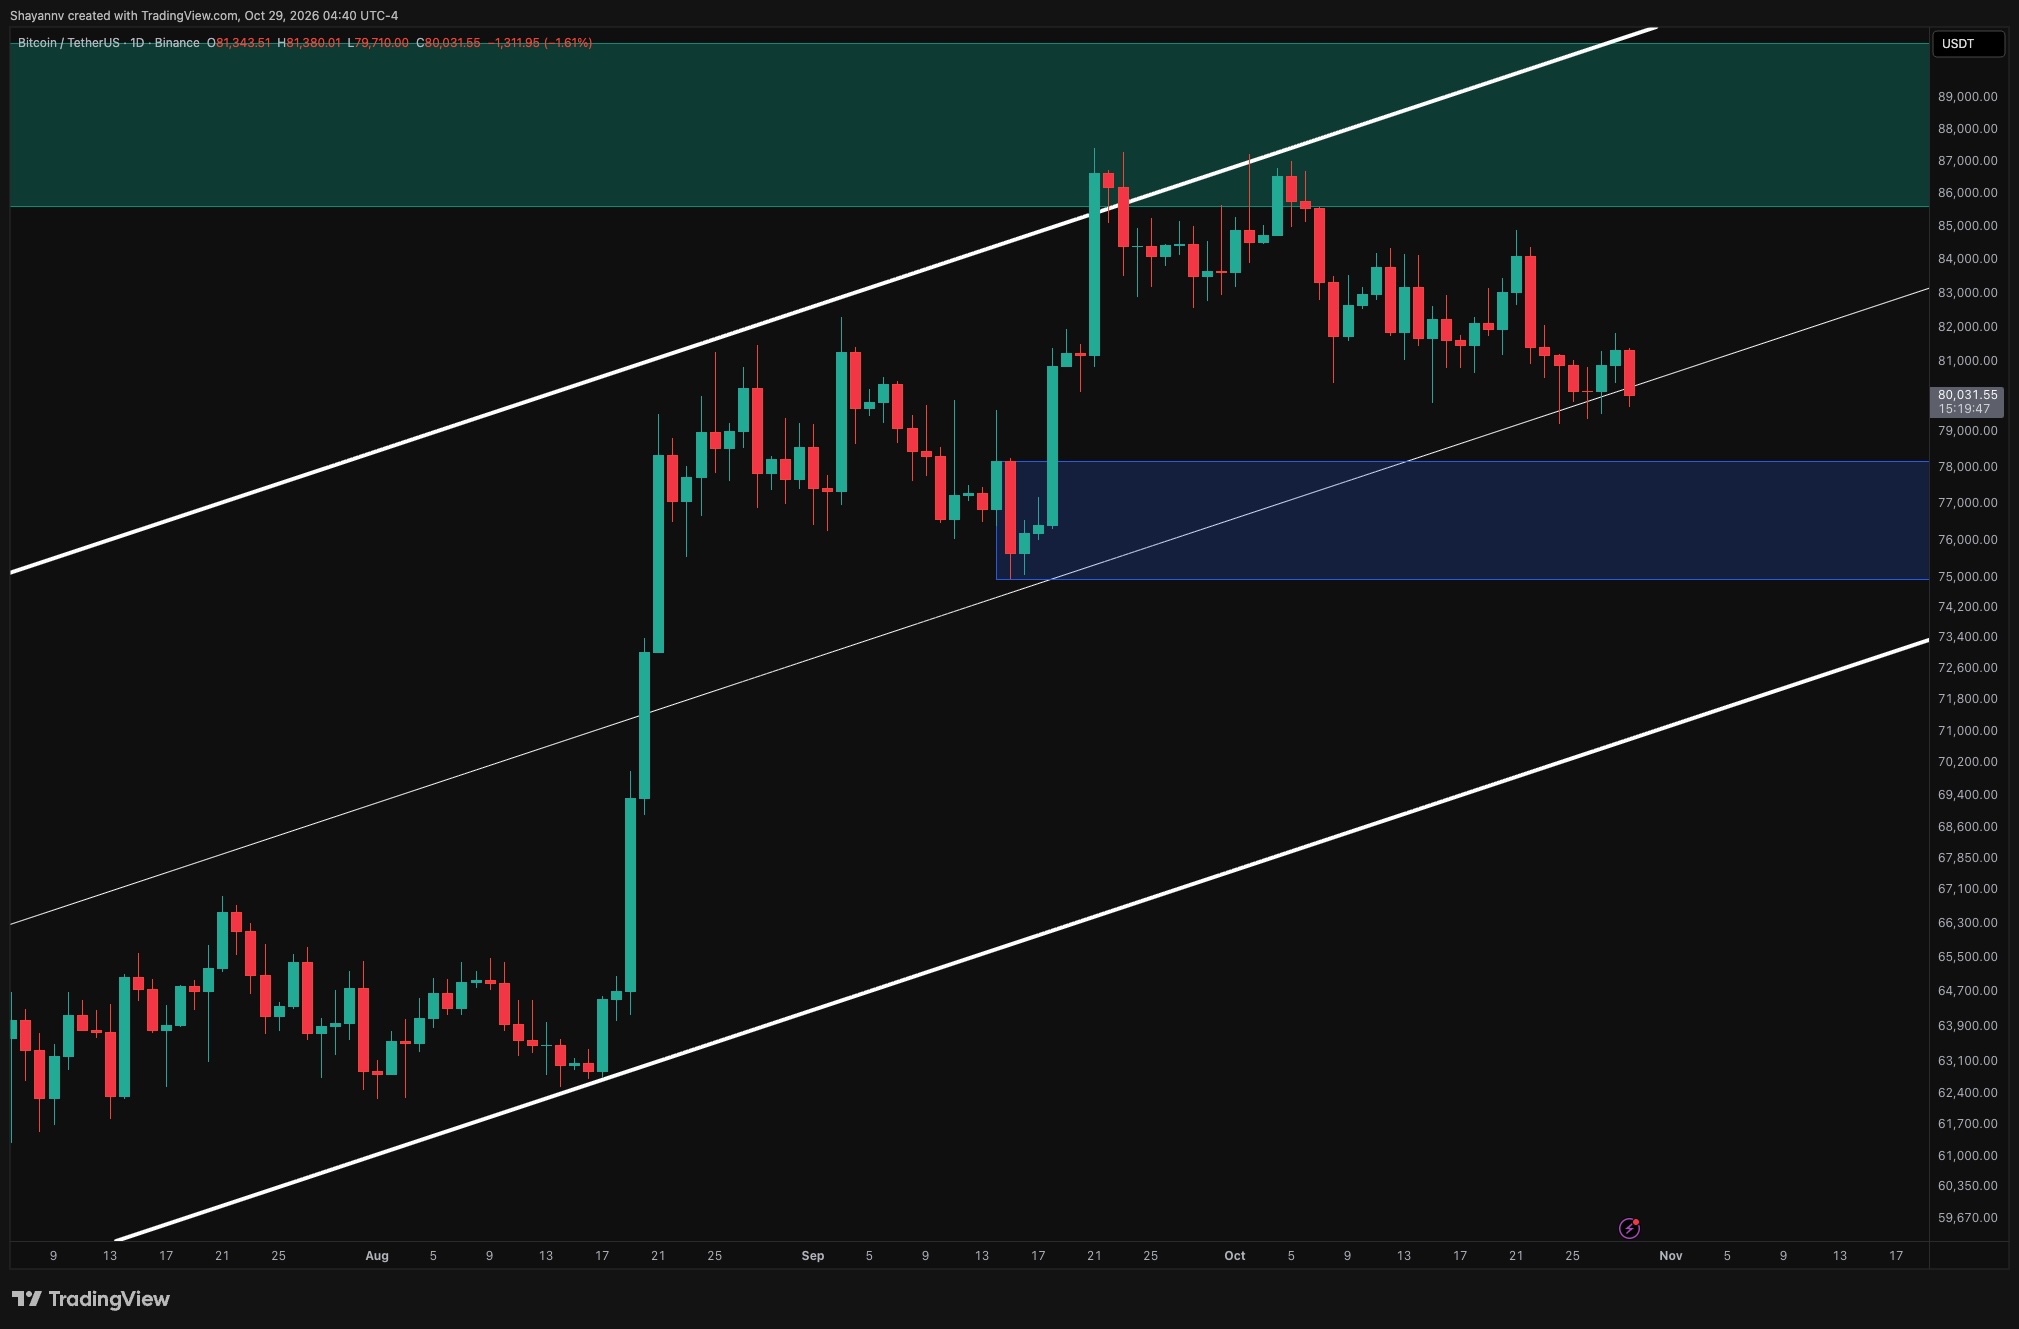
On the daily timeframe, Bitcoin continues to form lower highs following its rejection from the $85.5K–$90.5K supply zone. The latest rebound stalled around $81.5K–$82K before a bearish candle pushed the price back toward $80K and the ascending channel’s midpoint.
Repeated tests of this trendline have yet to produce a sustained recovery. A decisive daily close beneath it, followed by a loss of the recent lows around $79.2K–$79.5K, would favor a deeper correction toward the highlighted $75K–$78K demand zone. This region contains the base of September’s rally and remains the next major daily support.
Conversely, holding nearby support and reclaiming $81.5K–$82K would ease immediate pressure. Buyers would then need to overcome the $84K–$85K resistance area to interrupt the sequence of lower highs. Until then, rebounds remain vulnerable to renewed selling.
BTC/USDT 4-Hour Chart
The 4-hour chart shows Bitcoin trading below its broken ascending trendline. The latest recovery toward $81.6K–$81.8K failed beneath that line, reinforcing its role as overhead resistance and sending the price back toward $80K.
The highlighted $78.4K–$79.6K demand zone is now the immediate downside focus. Recent probes into its upper portion have attracted buying interest, but those reactions have not restored bullish structure. Sustained acceptance below $79.6K would expose the zone’s lower boundary around $78.4K. A breakdown beneath the entire area could extend the correction toward the next demand zone at approximately $75K–$76.3K.
For buyers, a recovery through $81.8K–$82K and the broken trendline would provide an initial structural improvement. Beyond that, the $84.2K–$84.9K supply zone remains a significant barrier, followed by broader resistance at $86K–$87.2K.

Sentiment Analysis
The Bitcoin Spot Average Order Size chart shows frequent big-whale readings during October’s retreat toward $80K–$82K. These green observations indicate larger average spot trades, highlighting continued large-order participation as Bitcoin struggles to sustain rebounds.
This activity could introduce additional selling pressure if large participants are distributing holdings or reducing exposure. Combined with lower highs and the loss of short-term trendline support, persistent whale selling would increase the risk of a deeper move into nearby demand.
However, average order size does not identify whether those trades are buyer- or seller-initiated, so the readings alone cannot confirm distribution. Earlier whale-sized activity also appeared around the June–August base before the subsequent rally. Continued price weakness alongside large orders would strengthen the selling-pressure interpretation, while a sustained reclaim of $82K would suggest that demand is absorbing supply more effectively.

The post Bitcoin Price Analysis: How Far Could BTC Crash if $80K Support Breaks? appeared first on CryptoPotato.







 English (US) ·