
TLDR:
- Bitcoin has fallen 49.53% from its October 6, 2025 ATH, wiping out roughly $1.2 trillion in total market cap.
- The BPDA% metric sits deep below its one-year average, signaling extreme stress, capitulation, and widespread panic selling.
- Bitcoin’s Realized Price near $54,600 marks a historically significant accumulation zone during past bear market cycles.
- The $49,000 to $42,000 range holds the highest probability of bear exhaustion and may signal the start of the next cycle.
Bitcoin’s 49.53% decline from its all-time high has wiped out roughly $1.2 trillion in market value. The drop has renewed serious debate about how far this bear market can extend.
On October 6, 2025, Bitcoin’s market cap sat at $2.4891 trillion. Today, it has fallen to $1.2918 trillion. With extreme fear gripping the market and macro pressures mounting, analysts are now mapping the levels where Bitcoin could finally find its floor.
On-Chain Data Points to Where Bitcoin’s Decline May Stall
The BTC Price Drawdown Analysis (BPDA%) is one metric drawing close attention right now. When this reading falls far below its one-year average, it historically marks phases of stress, capitulation, and panic. That is exactly where it stands at this moment.
Crypto analyst GugaOnChain flagged this condition, noting that the current drawdown places Bitcoin in extreme stress territory.
Macro factors are adding pressure, particularly the 10% global tariffs announced by the Trump administration. These developments have kept fear elevated across broader risk markets.
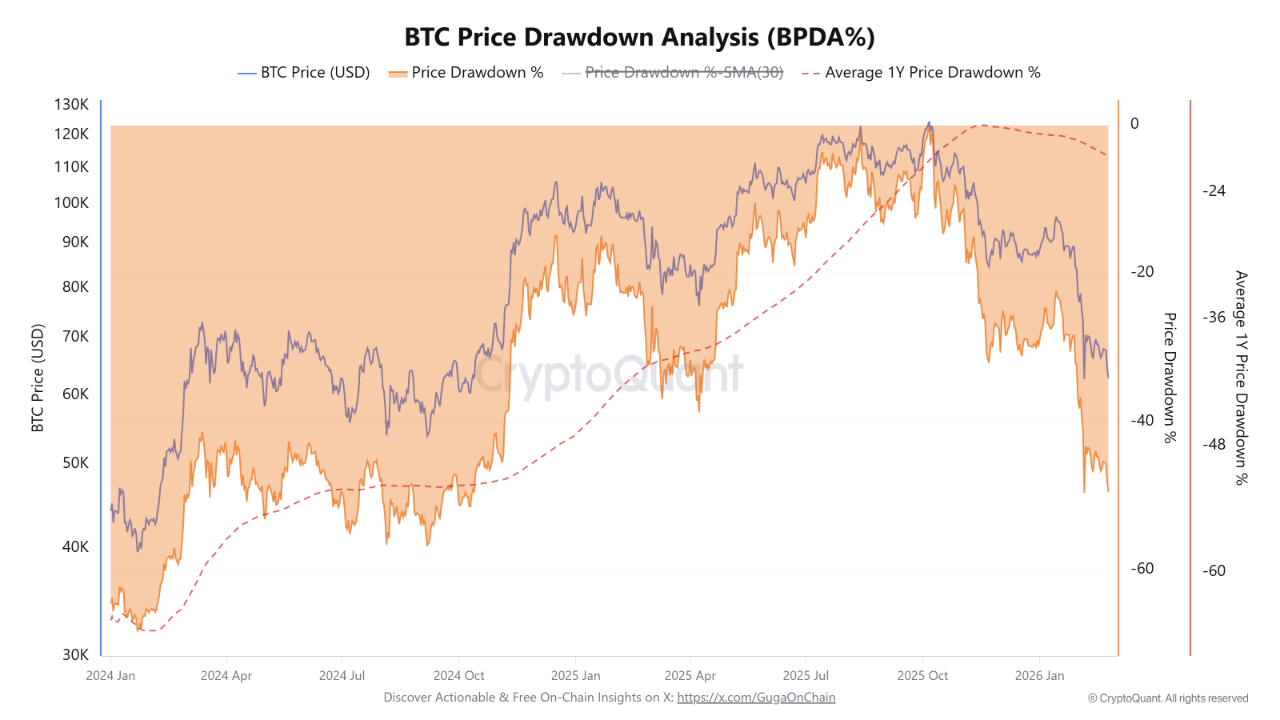
Source: Cryptoquant
When BPDA% sits near its one-year average, the market is considered to be within a normal historical pattern. A reading well above that average typically signals recovery or relative stability. Neither condition applies today, which is why analysts continue watching lower levels carefully.
The data, therefore, suggests the correction may not be over. However, history also shows that readings this deep tend to precede meaningful accumulation phases. The question now is which price level triggers that shift.
Four Price Levels That Could Determine How Low Bitcoin Goes
GugaOnChain identified four support zones that may define Bitcoin’s downside from here. The $60,000 level is the nearest, though it is considered less likely to hold as a durable bottom given current momentum.
Below that, Bitcoin’s Realized Price near $54,600 becomes relevant. This metric reflects the average price at which all coins last moved on-chain. Historically, the Realized Price has acted as a magnet for accumulation activity during bear markets.
Further down, the $49,000 region carries the highest probability of bear exhaustion based on the analysis. This zone has previously drawn in long-term holders who view deep corrections as entry opportunities rather than reasons to exit.
The $42,000 level represents the most extreme scenario outlined in the data. While it would place a large portion of the market in unrealized loss, GugaOnChain describes it as an excellent area for initial long-term entries.
If on-chain metrics confirm seller exhaustion at any of these levels, the range between $49,000 and $42,000 could mark not just the bottom of this bear market, but the foundation for Bitcoin’s next major cycle.


 English (US) ·