
 4 weeks ago
30
4 weeks ago
30
TLDR
- Bitcoin is trading at $64,038, sitting below its SMA7, SMA20, EMA12, and EMA26.
- Resistance sits at $64,766 and $65,494, while support is marked at $63,289 and $62,539.
- Retail traders (60.5% long) and top traders (62% long) are leaning bullish, but open interest fell 1.14% in 24 hours.
- The Stochastic oscillator is in oversold territory, pointing to a possible short-term bounce.
- Analyst Tom Lee’s January 2026 comment that Bitcoin had “yet to peak” hasn’t matched price action, with BTC still around $7,600 below its 200-day average.
Bitcoin is trading at $64,038, and it isn’t moving much in either direction. Price is stuck below four short-term averages at once: the SMA7, SMA20, EMA12, and EMA26.
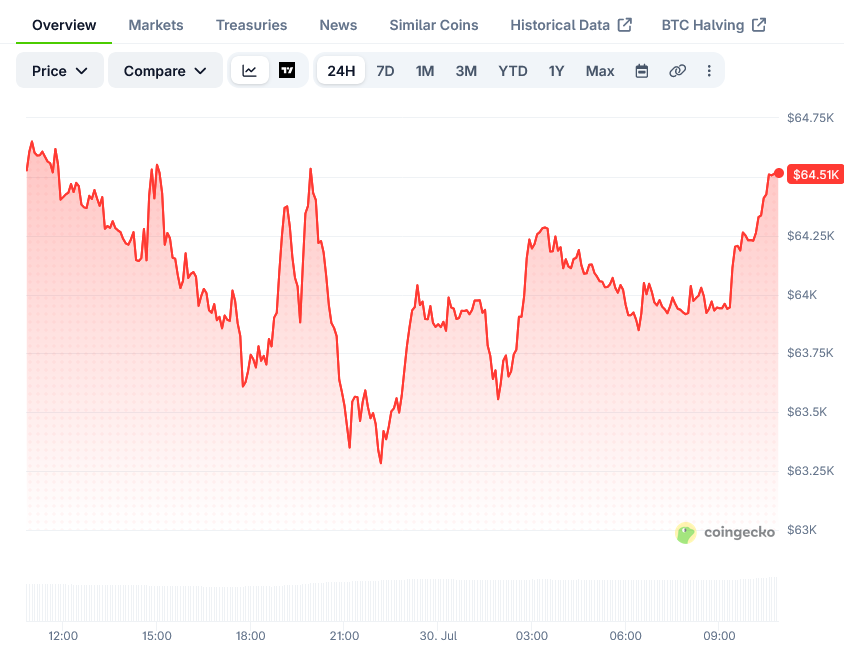
The intraday range has been narrow, running between $63,267 and $64,744. The average true range is $1,476, and there hasn’t been one strong directional move all day.
The SMA200 is much higher, at $71,635. That gap shows Bitcoin has been trading below its long-term average for some time now.
Key Price Levels
The pivot point is $64,017, which is almost exactly where Bitcoin sits right now. That makes the next few hours important for direction.
 Bitcoin Price on CoinGecko
On the upside, the first resistance is $64,766. That level matches the day’s high and has already turned price back once today.
The bigger resistance level is $65,494. This is where the SMA20 and the Bollinger midband both line up, forming a thicker ceiling.
On the downside, support sits at $63,289, close to the SMA50 at $63,440. Below that, the lower Bollinger Band and a support zone both sit near $62,539 to $62,637.
The Bollinger %B reading is 0.38, meaning price is in the lower part of the band. Spot volume over the last 24 hours came in at $1.08 billion.
Trader Positioning and Sentiment
Retail traders are 60.5% long, and top traders, often called smart money, are 62% long. The taker buy/sell ratio is 1.17, showing slightly more aggressive buying than selling.
At the same time, open interest dropped 1.14% over the past day. The MACD histogram is sitting right at zero, showing little momentum either way.
Funding is at 0.0085%, which is close to neutral. With many traders already long, a sharp drop could trigger a wave of stop-outs.
The Stochastic oscillator is at 33.98 on %K and 27.18 on %D. Both readings are in oversold territory and are starting to cross, which can sometimes lead to a short bounce.
Analyst Tom Lee weighed in on Bitcoin back in January 2026, saying the asset had “yet to peak.” That comment hasn’t lined up with where price is now, since BTC remains about $7,600 below its 200-day average of $71,635.
Right now, Bitcoin is trading almost exactly at its pivot point of $64,017, with the $64,038 price sitting just above it. The next move past $64,766 or below $63,289 will likely set the short-term direction.
The post Bitcoin (BTC) Price: Support at $63,289 Tested as Momentum Stalls appeared first on Blockonomi.







 English (US) ·